![]() Week One – 1/16-1/18
Week One – 1/16-1/18
Tuesday
- Introduction to course, expectations
- WordPress setup
- What is data visualization? What is it not?
- Discuss tufte graphical integrity
- Visit http://viz.wtf/ — Select two visualizations to discuss on Thursday
- For Thursday, read Elijah Meeks, Digital Humanities as Thunderdome
Thursday
- What is Data Viz for/in Digital Humanities?
- Examples of Data Viz from students and Faull (moravianlives.org and readysetfitapp.org)
- Discuss Meeks
Homework
- Weekend Reading: Stefan Sinclair et al, Information Visualization for Humanities Scholars
- Read Faull, Text Analysis and Visualization
- Practice blog post–quick write up of two examples of bad data viz and two screenshots. File under category “practice”
Week Two — 1/23-1/25
Tuesday
- Discussion of Reading: Sinclair
- Examination of Digital Humanities Sample Book
- Student work in DH
- Digital Scholarship Summer Research Fellow info
- Read Meirelles, Chapter 1, Hierarchical Knowledge Structures
- optional, Lima Chapter 1
Thursday
- Discussion of Lima, Chapter 1 and Meirelles, Chapter 1
- The ethics of dataviz–the question of human experience
- Holocaust Geographies Collaborative—-when mapping becomes more than spatial.
- The aesthetics of dataviz-Windmap—-http://hint.fm/wind/
- A Typology of Data Viz: Examination of knowledge structures presented as trees; graphs; clouds
Homework
- Assignment 1: due Tuesday 8am on the website
- Read Lima, Lima Chapter 2 and Meirelles Chapter 2
Week Three — 1/30-2/1
Tuesday
- Networks. Discuss the readings
- Introduction to Voyant–text visualization
- What do networks in text mean?
For Thursday, read Meirelles, Chapter 6.
Thursday
- Lab: Voyant 2.0; set up
- (You can use the online version or create your own more stable instance on your computer)
- ## Voyant Server ##Voyant Server is a web application launcher for Voyant Tools – it makes it easy to run a stand-alone instance of Voyant Tools on your local machine, which has several potential advantages (performance, security, privacy, reliability, etc.) compared to the [hosted version](http://voyant-tools.org).## Installation ##See the [latest release](https://github.com/sgsinclair/VoyantServer/releases/latest) and download the VoyantServer zip file. Unzip the file (be sure to actually extract the contents into a real directory) and double-click on the VoyantServer.jar file (on Macs you may need to Ctrl-click on the VoyantServer.jar, select open and confirm the opening – this is because of security precautions in OS X).Once you open VoyantServer.jar a controller application will appear (that allows you stop stop the server, see error messages, change settings, etc.) and a new browser will also appear with Voyant Tools. That’s it!## License ##
Voyant Server is released under the same license as JettyDesktop, the GNU General Public License v3.0 (see license-GPL3.txt in this directory).- (Stefan Sinclair’s Workshop Instructions)
- Google Drive –sample .txt files for analysis
- Voyant Lab, cont.
- Creating raw text files
- Metadata/data/interpretation
Homework
- Discussions and Reading for Tuesday:
- Over the weekend, work on preparing your corpus and start reading through the Instructions for Jigsaw. Download the software, if you can.
Week Four — 2/6-2/8
Tuesday
- Platforms for Data Viz: the problem with intention
- The origins of the algorithm–what happens when the data viz designer comes from a quantitative background and not qualitative? (security, business, science, statistics, geo-physical)
Thursday
- Jigsaw lab
- Lab: learning Jigsaw
Homework
- Assignment 2. Due Tuesday 8am.
Week 5 — 2/13-2/15
Tuesday
- The Syntax of DataViz: How do we code and decode networks?
- Discuss Lima
- Mapping the Republic of Letters
Thursday
- What does a visualization suite look like when built by humanists and CS students?
- Lab: learning Palladio
- Class Outline
Homework
- Read Drucker 2016
- Explore these projects
Week Six — 2/20/-2/22
Tuesday

Palladio visualization of relationship network between place of baptism and name of baptized Indians (from archival data) - Discussion of Drucker
- Use pre-prepared structured data (Cushman Collection from M. Posner) or your own data to explore Palladio.
- Import your tabular data to Palladio. Check to see what the corrections to your data are in the “data” tab.
- Go to “graph” view and visualize the relationship between two dimensions of your data. Download a screenshot when you are ready.
- Add a “facet” to your visualization. This feature allows you to “drill down” into the data and produce multiple graphs based on changing facets. Download multiple screenshots of your different graphs.
- Add a “timespan” to your graph. How does the graph change as the timespan changes? Download screenshots.
- For Thursday, read Scott Weingart on networks
Thursday
- Compare with Google Fusion Tables
Homework
- Assignment 3: Visualize a set of literary/cultural relations
- For Tuesday, read Meirelles, Chapter 3 “Temporal Schemes”
Week Seven –2/27-3/1
Tuesday
- Discuss and examine Meirelles, Chapter 3
- Timeline JS and Timemapper
- Read Rosenberg/Grafton, Chapter 1 Cartographies of Time
Thursday
- Gallery visit
Homework
- Read Meirelles, Chapter 4 Spatial Studies
Week 8 3/6-3/8
Tuesday
- Student presentations of examples of time schemas in projects. Choose an example from either Meirelles or Grafton/Rosenberg of a visualization of a time schema. Then compare this to your own timeline creation with your data.
Thursday
- Discuss Chapter 4 in Meirelles
- Using Maps in Data Visualization
- Examine concepts and Case Studies
- Introduce ArcMap and/or Carto
Homework over break, read Segel and Heer, “Narrative Visualization”
Week 9 3/20-3/22
- Discussion of Segel and Heer
- Video of Edward Segel “How to tell stories with data”
- The importance of narrative in Data Viz–see Edge Maps
- Examples of Cultural Heritage and Digital Inquiry
- For Thursday, watch Manuel Lima – Visual Complexity: 10 years of mapping complex networks from VISUALIZED on Vimeo.
Thursday, 3/22
- Visualcomplexity.com
- Coins
- Shifted Maps
- Air BnB vs. Berlin
- Visualizing Historical Collections
- Syntax of New Language?
- Assignment 4: Design Critique-Networks: due Tuesday 3/27 8am.

Week 10 3/27-3/29
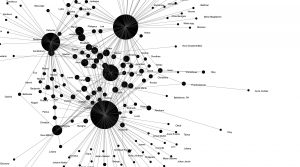
- Tuesday, Network visualization with Gephi
- Using Facebook API
- http://thepoliticsofsystems.net/permafiles/rieder_websci.pdf
- Instructions for Gephi (using preloaded file)
- Instructions for Visualizing your Facebook data
- Should I use networks for my data?
- Thursday
- Gephi workshop
- Index of Complex Networks
Week 11
Tuesday 4/3
- Introduce Native American database
- How to visualize this multi-dimensional data?

Thursday 4/5
- Work on visualizing database
- Division of data entry labor
Week 12 4/10-4/12
- Gephi work
- Assignment 5 — submission date April 13 8am
Week 13 4/17-4/19
Final project prep
Week 14 4/24-4/26–
Class held in HumLab in the basement of the Hildreth-Mirza Hall –Humanities Center
Final projects-presentations