Skip to the content
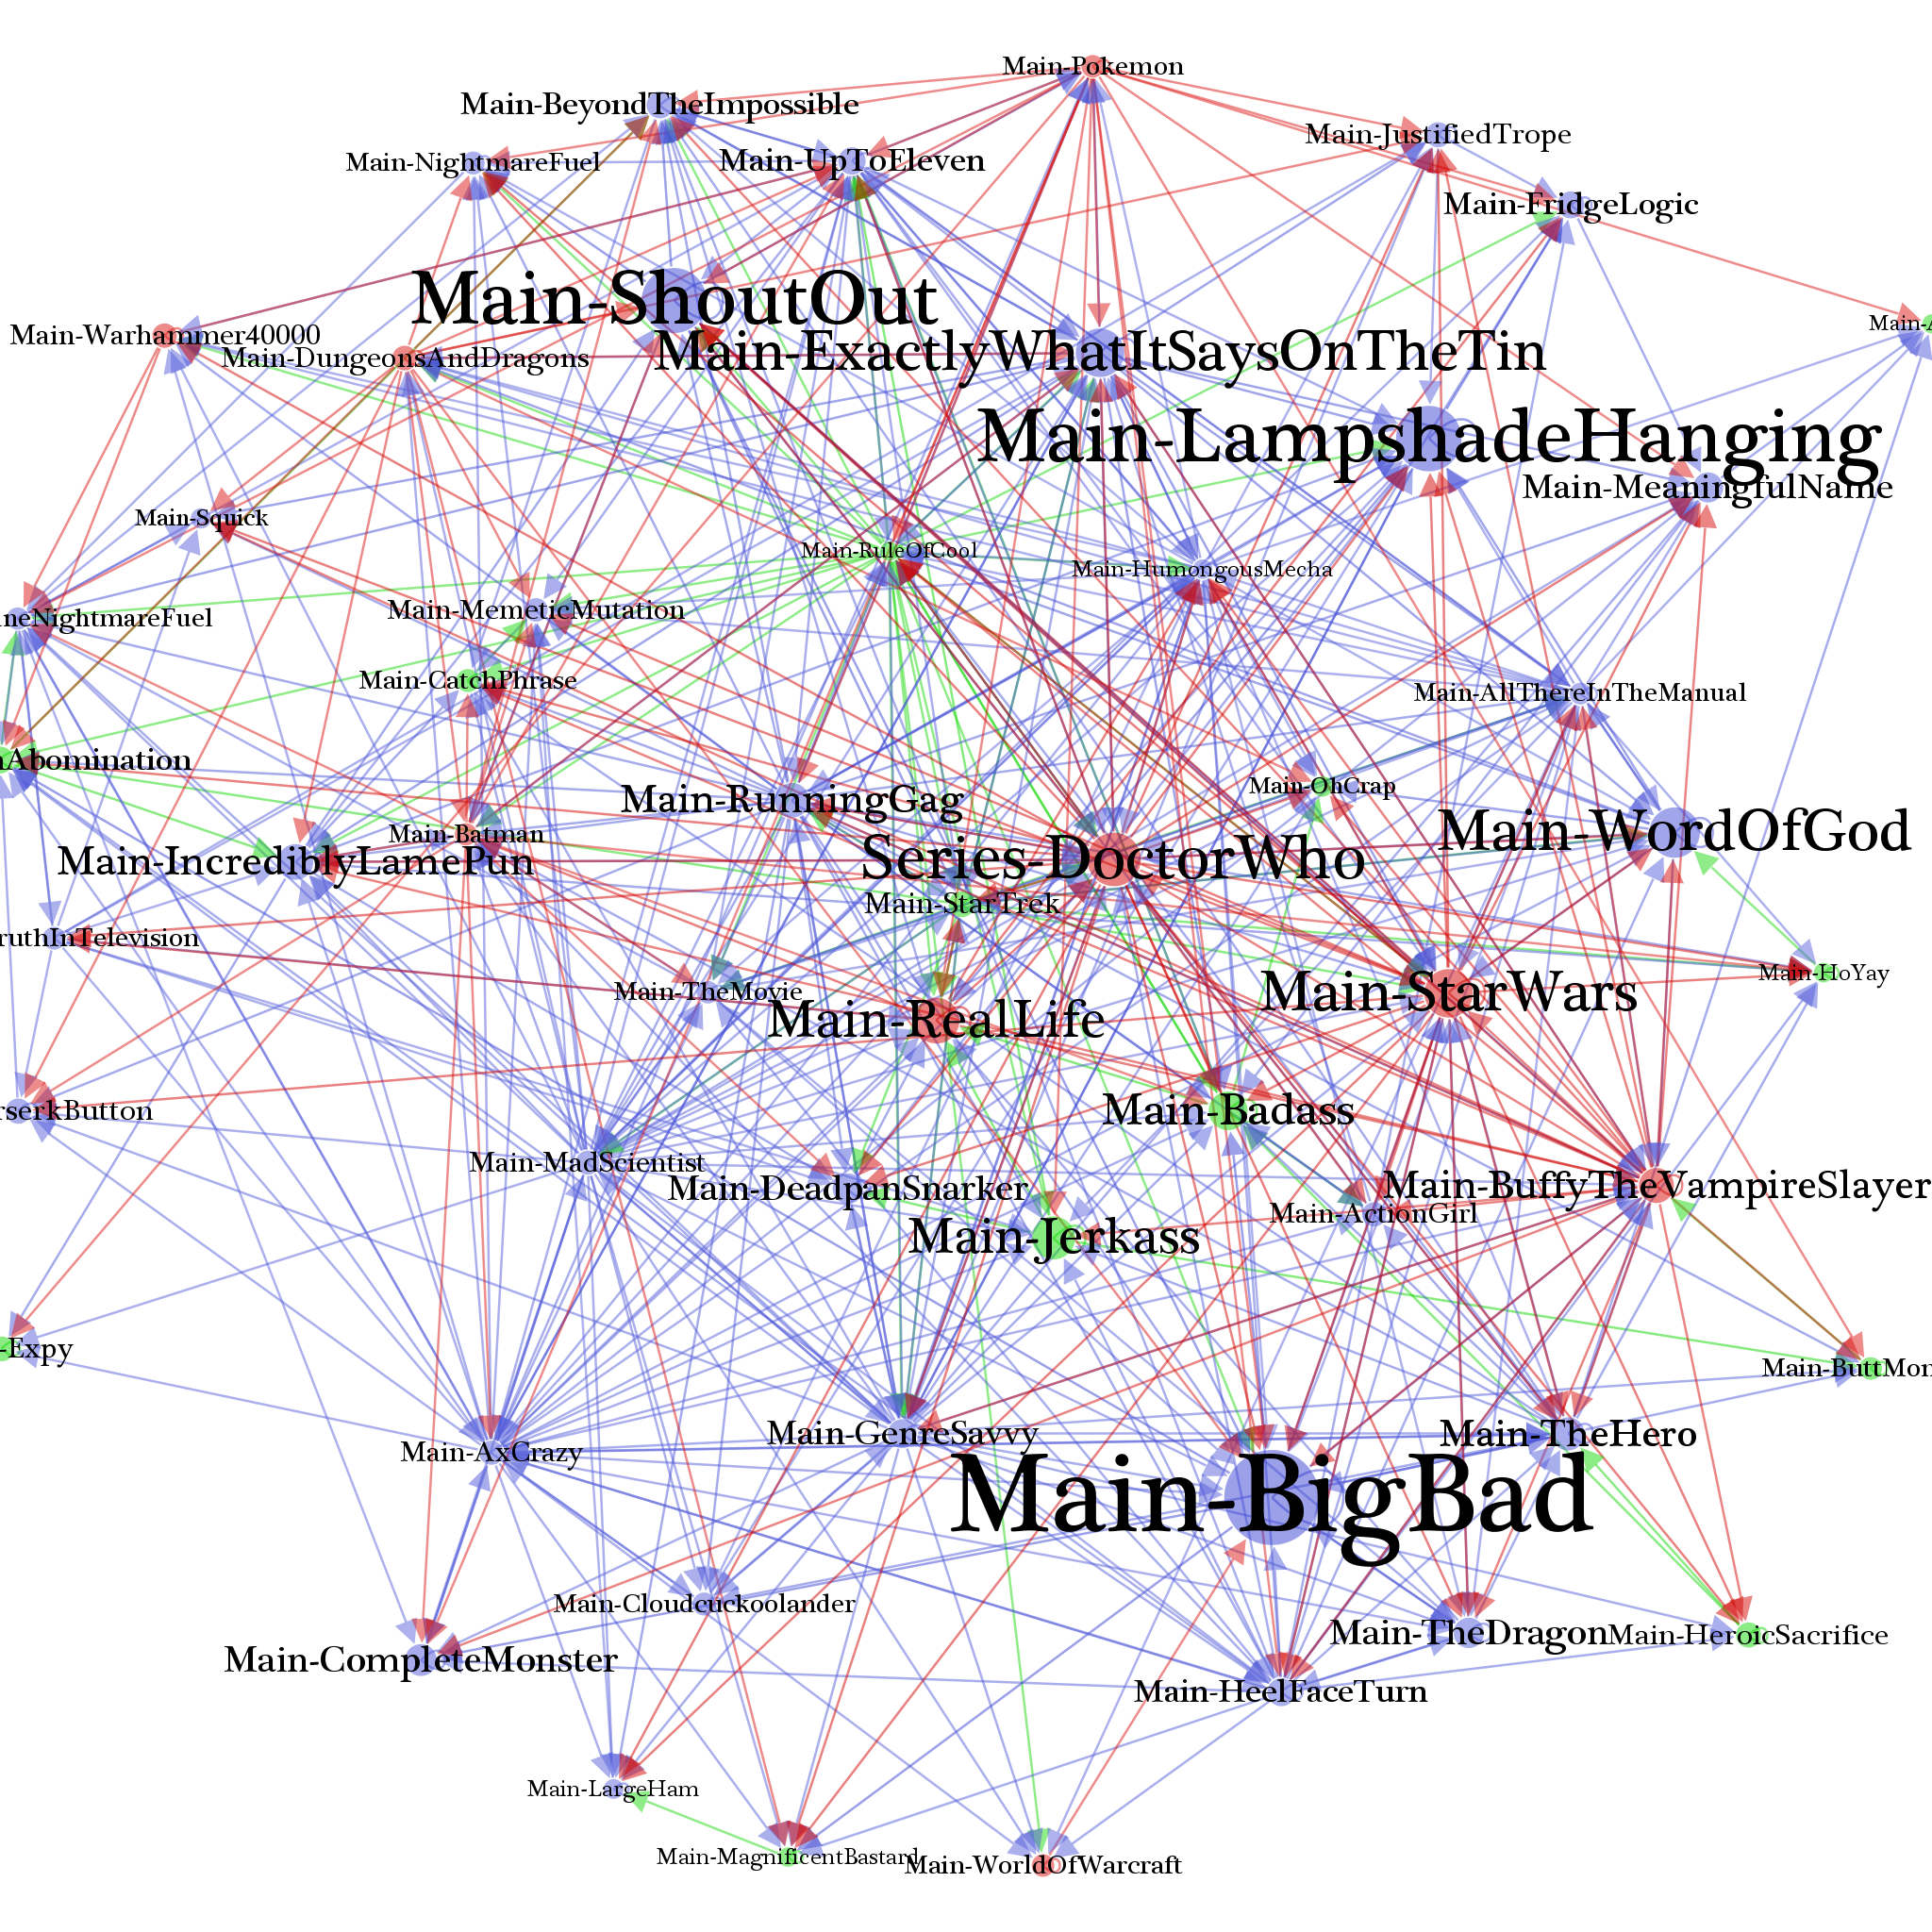
The 54 most central pages on TV Tropes, considering only links between trope, work and index pages. Tropes are in blue, works are in red and indexes are in green. To disambiguate names, the namespace is appended to the trope, index or work name. Elijah Meeks
Tanya Clement, “Text Analysis, Data Mining, and Visualizations in Literary Scholarship”https://dlsanthology.commons.mla.org/text-analysis-data-mining-and-visualizations-in-literary-scholarship/
Johanna Drucker, Graphesis: “Interpreting Visualization::Visualizing Interpretation.” Visual Forms of Knowledge Production. Harvard UP, Cambridge, MA. 2014. 56-137.http://www.students.bucknell.edu/projects/HUMN10001/Drucker.pdf
Katherine Faull, “The Importance of Understanding Visual Rhetoric” on katiefaull.com
Elijah Meek’s blogpost http://elijahmeeks.com
Dmitry Paranyushkin, Identifying the Pathways for Meaning Circulation using Text Network Analysis By Nodus Labs. Published October 2011, Berlin.
Edward Segel and Jeffrey Heer, “Narrative Visualization: Telling Stories with Data”http://egerber.mech.northwestern.edu/wp-content/uploads/2015/02/Narrative_Visualization.pdf
Daniel Rosenberg, Data before the Fac t (draft–not for circulation)Stéfan Sinclair, Stan Ruecker, and Milena Radzikowska, “Information Visualization for Humanities Scholars”https://dlsanthology.commons.mla.org/information-visualization-for-humanities-scholars/
Ted Underwood, “Seven Ways Humanists are Using Computers to Understand Text.” http://tedunderwood.com/2015/06/04/seven-ways-humanists-are-using-computers-to-understand-text/