Categories
Assignment 1

Assignment 1 – Steve Rizio

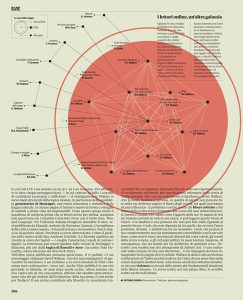
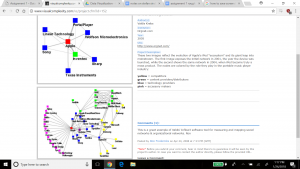
The first visualization from Visual Complexity.com that caught my eye is titled “iPod Ecosystem.”

It got my attention because it reminds me of my older sister’s stories about how she used to download and listen to music before Apple’s giant leap forward into shaping the music industry and song consumption.  Being born in 1998, I was always accustomed to Apple’s huge presence and popularity in the music market.

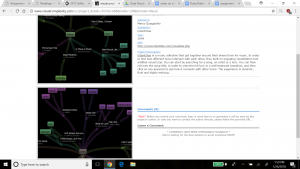
The two images juxtaposed against each other tell the story of the iPod’s transition into a mass market product quite nicely.  The first image depicts the initial business players in the days of 2001 – we see how sparse and limited Apple’s network connections were at the start.  The bottom image depicts the rampant market growth that resulted just three years later – the image shows how more diverse and full the iPod ecosystem business connections had become.

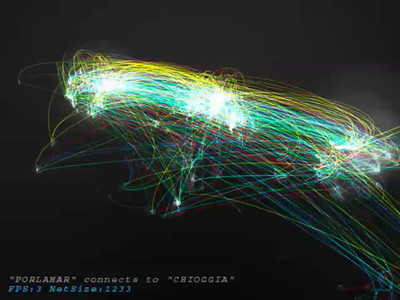
This other visualization, “visual i/zer”, lets users search for a song and see how different lyrics intersect with each other.

The user can do this by simply choosing and clicking on any keyword in a lyric to see how it connects with other lyrics using that same keyword.  It caught my attention because I think it is a good demonstration of how “iPod Ecosystem” in contrast fails to be engaging.

Although “iPod’s Ecosystem” is insightful, it leaves me wanting more. The lack of interactivity is a huge letdown as I would naturally want to click on the iPod’s connections to see specifically what each relationship in the ecosystem provides as a service or technology – similar to how “visual i/zer” works in dynamically showing the lyrical ecosystem.

The contrast between “iPod’s Environment” and “visual i/zer” highlights differences between static and dynamic visualization. It also proves Stéfan Sinclair, Stan Ruecker, and Milena Radzikowska points on how interactive visualizations are objectively superior to static visualizations.

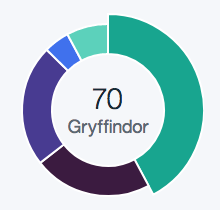
“Interactive visualizations, on the other hand, aim to explore available information, often as part of a process that is both sequential and iterative. That is, some steps come before others, but the researcher may revisit previous steps at a later stage and make different choices, informed by the outcomes produced in the interim. In a pie chart, by contrast, a static, synchronic object, the visual subdivision of the whole into parts can be useful, but the format does not readily lend itself to experimentation.”

The static connections depicted in “iPod’s Environment” are fine, but do not offer users the ability to explore different parts of the network, like  “visual i/zer” allows.  The iterative feature of “visual i/zer” really hooked me in, and made me immediately feel that “iPod’s Environment” was flat in the info it offered in comparison.

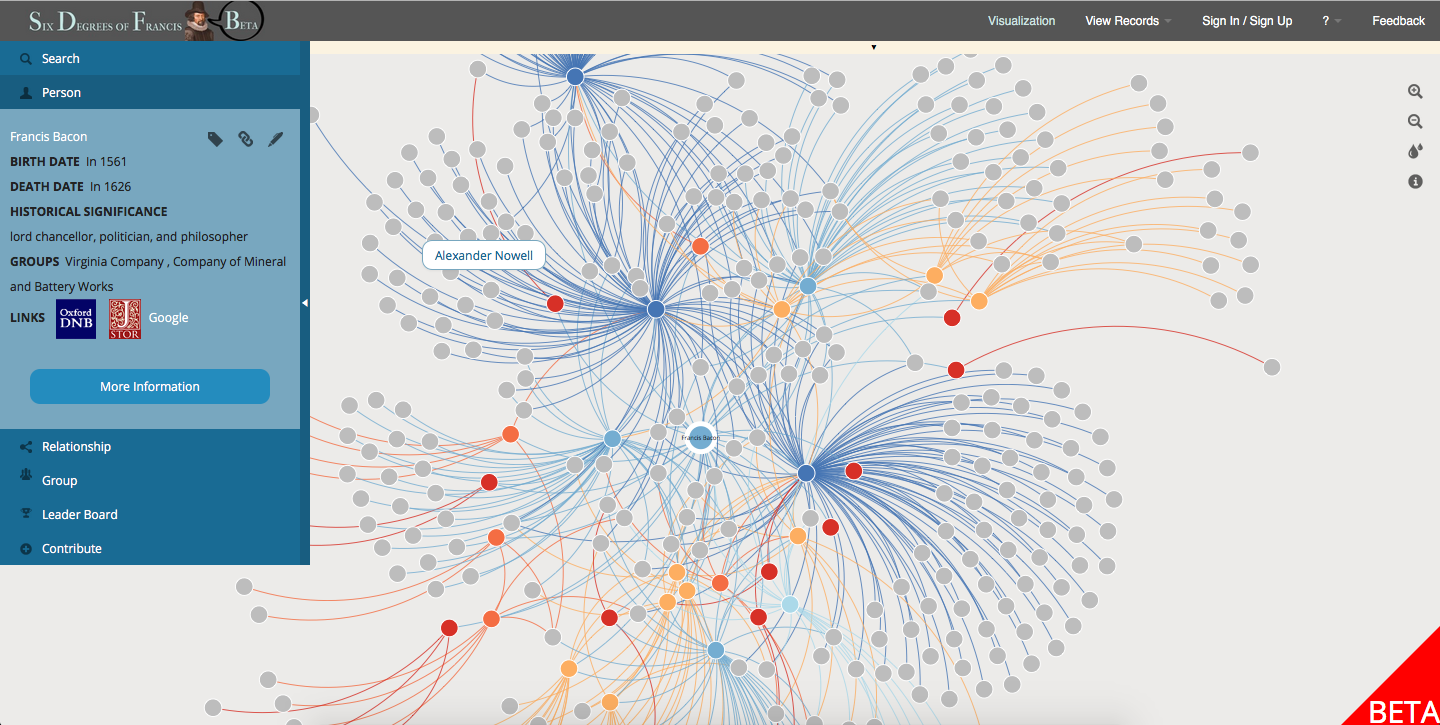
My favorite visualization from the DH Sample Book was the one we looked over in class, the “Map of Early Modern London.”  This one is intriguing  because of its ability to show such a vast amount of information in an easy-to-use way.  Users can view the map through different perspectives by choosing the “locations by category” tool.  Bridges, churches, neighborhoods, etc. can be found and highlighted simply by clicking on them, giving users a lot of power and variety with their research options.   The format of its interactive user interface lets researchers explore freely and therefore draw their own conclusions about early London.   Like “visual i/zer”, the “Map of Early Modern London” reflects the best kind of visualization tools that our readings this week discuss.

Categories
Assignment 1

Assignment 1

First example
Second Example

For my two selections , I tried to choose two that showed the different ways visualizations can be effective. The first visualization is very clean and easily legible. Its value is in being easily comprehensible and conveying that information efficiently. While its unfortunately not in English, you can see just from its neutral presentation how it will give very precise information for the reader to digest, while using imagery to assist the reading. The visualization depicts connections between contemporary works of fiction and non fiction. The nodes are works and the edges are concepts the connect them. This is a very intuitive design that sells its ideas very cleanly. It draws attention where needed and is visually pleasing. There aren’t too many dimensions going on as well, adding to its simplicity and ease of use. The second visualization is the opposite. Where as the first example was very literal, this one conveys the abstract. This visualization attempts to reveal the overlap in our deeply connected modern world. The creator took participants data and connected it abstractly with others.  The result is messy and indefinite. A hundred people could have a hundred different interpretations. No key is given to decipher what this any color or strength of light means. All is up to the reader to decide. I think these two showcase two of the many ways data visualization can be used. The first comes from an almost empirical background. The connections are cleanly drawn and  are easy to follow. The creator is clearly trying to suggest relationships between the works and has a clear message to share. The second is a free form experiment in art, showing our deep connections to strangers in a modern world, and allows for infinite interpretation while being extremely pleasing to look at. These don’t differ in the fact that they’re both very static in presentation, which makes the reader less able to interact with it as a whole.


This example I feel straddles the two schools of thought. This can be difficult because doing either method poorly can result in a lackluster visualization. I feel this one works excellently however. Just to start, its incredibly clean to look at. One can easily understand the gist of each area of the visualization, but it has detail for when closer inspection is needed. Furthermore, the ability to change the person being observed adds dimensions to the data. This is a great humanist visualization because it gives the detail needed to quickly understand the information, but also leaves that data up for varied and strong conclusions.

third example
Categories
Uncategorized

Two Bad Visualizations

Categories
practice

Homework 1

Categories
Uncategorized

Two Bad Visualizations

This is one is bad because the visualization is not to scale with the numbers.  At quick glance, Microsoft Edge seems to be much faster than both its competitors.  In reality, the raw numbers are pretty close.


This one is bad because the graph gives no context whatsoever.  I have no idea what this graph is trying to convey.  Something to do with how each candidate won their respected states? It is hard to decipher.

Categories
practice Uncategorized

Interesting vizualizations

I chose the following two visualizations because they stood out to me as being poor visual representations of data. The first (how india eats) has percentages that appear to be supposed to correspond to fractions of a circle that are not proportionate at all. The second (peak time for sports and leisure) is incredibly confusing in it’s nature, and although it was rather clever when I was able to finally decipher it, it took almost 10 minutes which is far too long for most readers hoping to see and understand quickly.


Categories
Uncategorized

Test

Random viz

You can write something here.

Categories
practice

Two Visualizations

Categories
practice

2 Visualizations

Categories
Uncategorized

Two Data Visualizations from viz.wtf