Categories
Assignment 1

Assignment 1

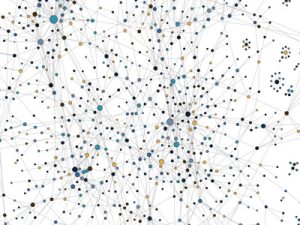
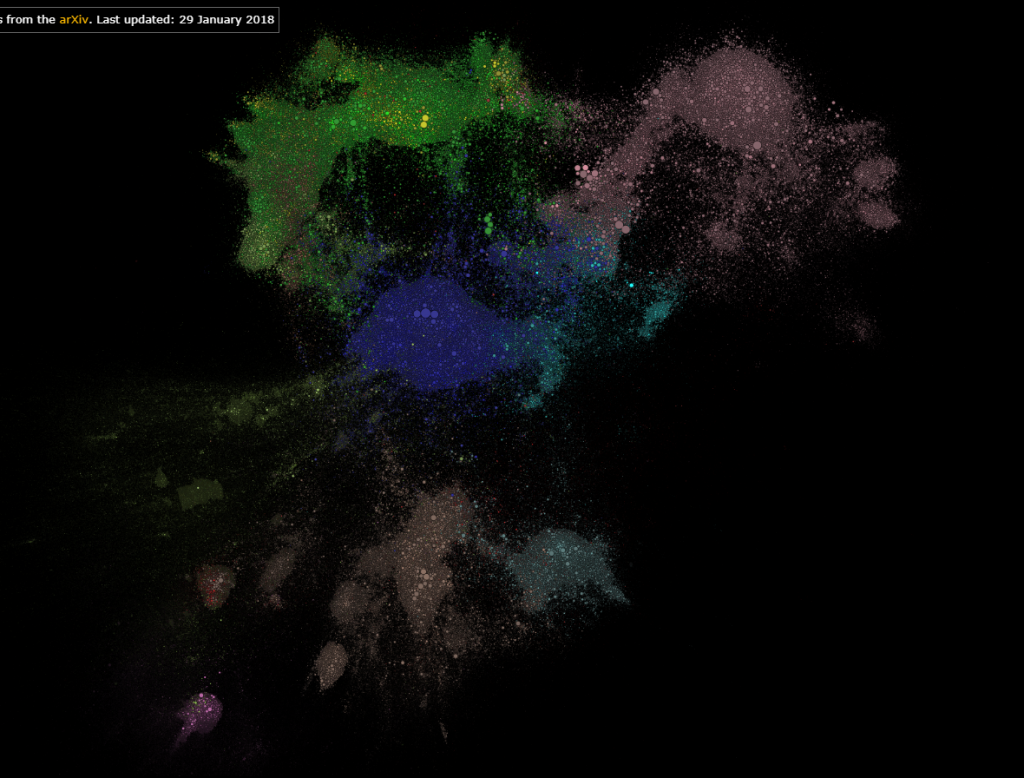
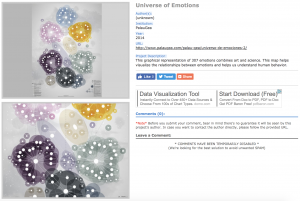
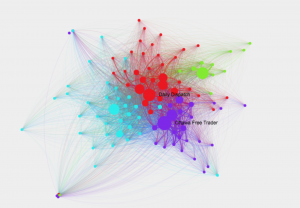
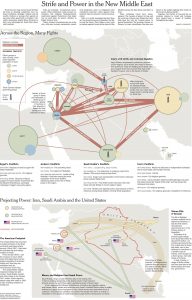
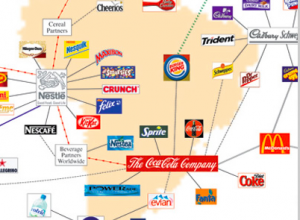
I chose this visualization mainly because it created an interesting visual of company connections that exists together in the market with products such as designer clothing, candy, and soft drinks. Although they are similar in the webbing design, there purpose differs as the first visualization has a more complex understanding. It shows ‘who owns what’ throughout various corporations across the world. This graph is a good example of dynamic visualization as it is effectively follows it’s purpose without misleading the viewer to another conclusion. The only downside that I can see from the first graph is that the world map in the background has no purpose. The graph doesn’t represent any company’s geographic locationwhich the average viewer would assume when they see a map.

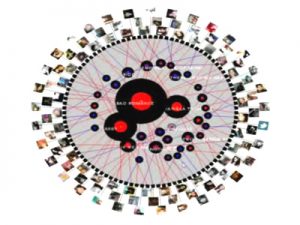
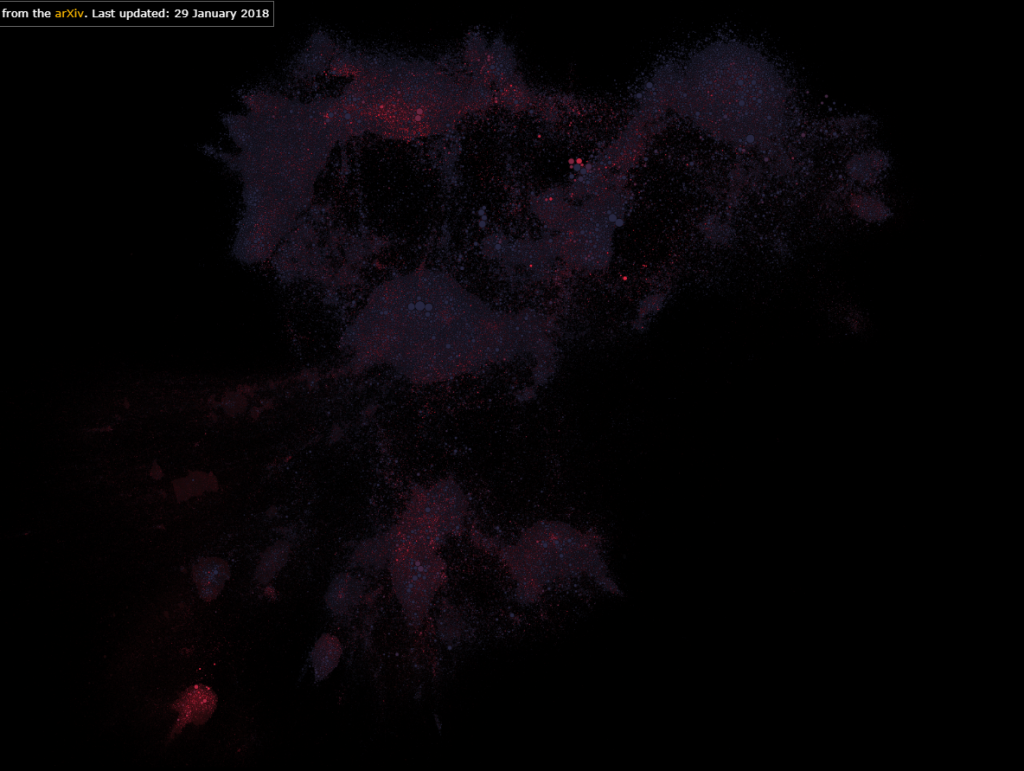
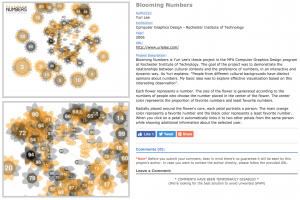
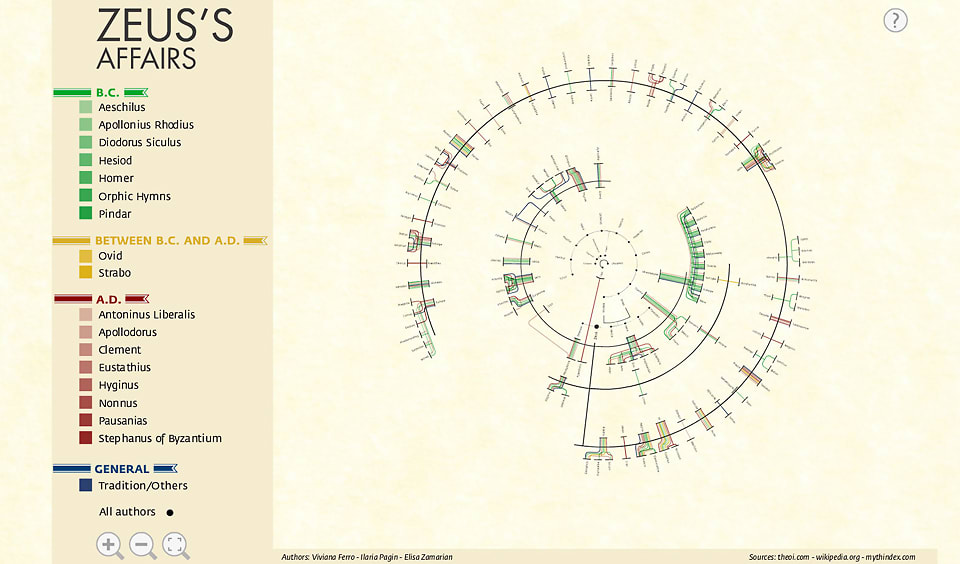
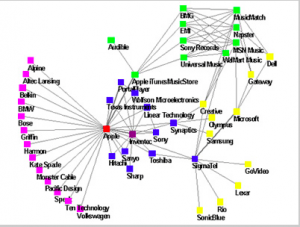
The second visualization is very simple and lacks vibrance as it appears very dull. However, this plain style illustrates an effective way of showing the branch offs connected to Apple. It also shows the evolution of Apple’s iPod “ecosystem” of music and sounds that have become a household name throughout society. Almost all of my electronics have came from Apple and I love their products which made this interesting for me to view. The visualization is clear and concise which i enjoyed, being that I could understand it’s purpose easily. 

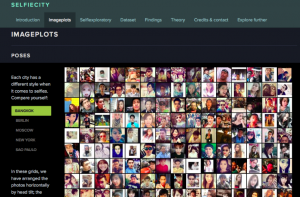
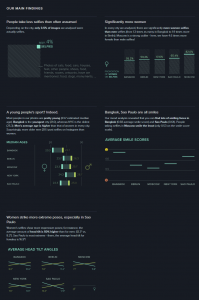
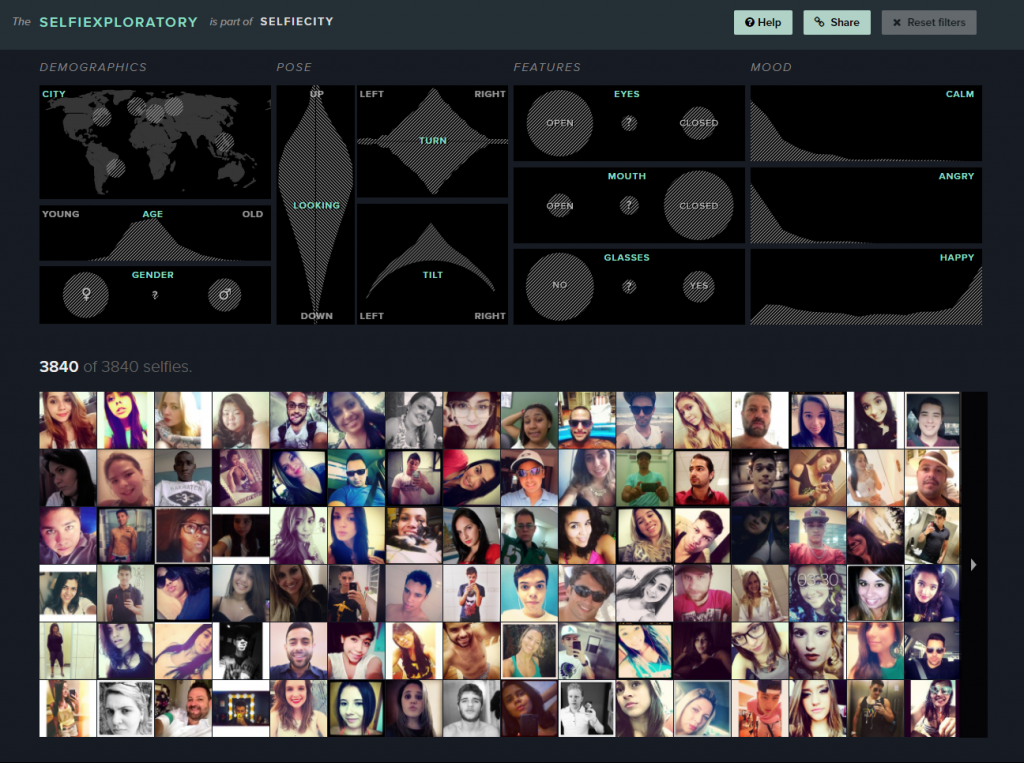
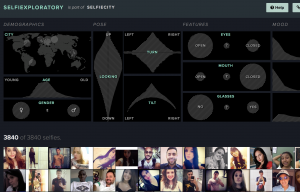
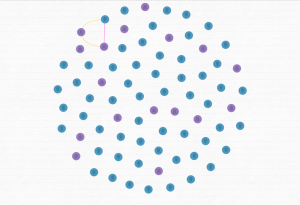
SelfieCity has always been one of my favorite visualizations due to it’s creative datasets that represent social networks most popular photo style. The software can take a simple self-portrait from popular cities such as New York, Moscow, Berlin, etc. and compile data to recognize trends and similarities within the people in those cities. You can use the site in a variety of ways as its viewer interactive system can be molded into a customized research. Overall, it’s a great tool to see how people are operating throughout daily life while also recognizing tendencies and trends. These visualizations help understand the websites purpose for creating a unique way of analyzing images.

Categories
Assignment 1

Assignment 1

The first visualization I choose is called “Twitter Lyrics” which is a rating system which uses Twitter to track the number of times a song is being quoted this is done to help understand the impact songs have on people’s lives. I found this visualization interesting because I can personally relate to this visualization. I love listening to music especially rap. A lot of my tweets from Twitter are inspired by the lyrics I hear from the music I come across. I love the fact that I can find always find a song/quote and connect it with how I’m feeling that day. I use the quotes from these songs to uplift myself as well as for motivation. Twitter Lyrics provides many ways to interact with the data and be viewed from different perspectives. I believe the visualization enable an artist to see how their listeners are interacting with their music. This visualization resembles a dynamic visualization because viewers are able to build their own conclusions from the data presented without it being misleading in any way.

The next visualization is “The Seattle Band Map” which is also categorized under music. This visualization unlike Twitter Lyrics documents the bands from the northwest region of the United States. The visualization shows how they have connected whether it be personal relationships or working together on songs. The creators of this visualization believe Seattle is a prominent area for music so to keep the area relevant they came up decided to create this lineage. This visualization drew my attention because I was fascinated how the creators made the visualization very informational. I find this visualization unlike Twitter Lyrics to be very more hands-on and interactive. This visualization, in particular, exemplifies a dynamic visualization as well because it’s very detailed and it doesn’t try to persuade the viewer any type of way other than showing you the social network of these bands. Yes, the visualization provides multiple ways of interacting with the data allowing it be viewed from different perspectives. Lastly, I believe this visualization leads to new and emergent ways of understanding the material because even though the visualization looks complexes it’s rather simple and helpful if you want to learn more about these bands.

After looking at a couple of software’s I decided I enjoyed a program known as Selfiecity. This is mainly due to the huge impact social media has on everyday human life. This software “investigates the style of self-portraits” in places like Bangkok, Berlin, Moscow, New York, and Sao Paulo. The primary focus of the software is visualization. Throughout Selfiecity the creators use different graphs to show the data taken from their research. The ultimate goal of the software is to see if there are differences in the selfies being taken in different places across the world. The website is very interactive allowing the viewers to play around and explore with the website enabling them to see thousands of selfies and the correlation the selfies have from the same places.


Categories
Assignment 1

Assignment 1

The Infinite Jukebox

The first visualization, called The Infinite Jukebox, caught my attention as I listen to and practice music regularly, and have taken music theory classes here at Bucknell. First of all, the visualization is quite pleasing to look at. Second, the idea of listening to different versions of a song you like in an infinite loop is really cool, in my opinion, though it can be tiring at some point. Finally, and most importantly, this visualization is a great tool for reading music. Of course, one can look at the sheet of the song or simply just listen to it. However, music is, I think, quite linear, which makes it challenging to see the overall structure of a piece of music.  On the Infinite Jukebox, however, one can see where musical ideas repeat by looking at the amount of connections. It would be really fascinating if the visualization allowed more than one song at a time, which could be used for analyzing similarities or influences between musicians (or for producing some awesome mashups).

Paperspace (colored by categories)
Paperspace (colored by age)

The second visualization that I found interesting was Paperspace. Firstly, it shows which fields in STEM are most researched. Secondly, it also shows research in one field interacts with those in another field. Finally, it also allows users to color the map by the age of the papers, which can reveal the current trend or topics of interest in STEM. In addition, one can tell, by interacting with this visualization, if a research topic is really “out there”.

Selfiecity’s Selfiexploratory
Selfiecity’s findings

For the visualization from the DH Sample Book, I chose Selfiecity. First of all, the design of the website is clean and modern. Second, in addition to the researchers’ own findings, which I think are very interesting and comprehensive, they also provide a section called “Selfiexploratory” for users to interact with their data (images). The filters in the “Selfiexploratory” section are very responsive and well-designed. They represent the variables they are changing with visual mapping and, at the same time, show how the quantitative data change directly on the sliders themselves.

These visualizations definitely exemplify Sinclair’s observation on the difference between static and interactive visualizations. Instead of providing immutable perspectives on the data, the visualizations mentioned above all allow users to adjust the parameters and come to their own conclusions. For example, the Infinite Jukebox lets the users adjust the probability and the threshold that a song might switch to a different section. The Paperspace visualization allows users to change how the papers are categorized and also updates its database frequently. Selfiecity provides users with probably the same tools that the researchers used to get their results.

Categories
Assignment 1

Assignment 1

Visual Complexity.com Examples:

“Universe of Emotions” – http://www.visualcomplexity.com/vc/project_details.cfm?id=926&index=44&domain=Semantic%20Networks

“Blooming Numbers” – http://www.visualcomplexity.com/vc/project_details.cfm?id=391&index=57&domain=Knowledge%20Networks

The “Universe of Emotions” and “Blooming Numbers” visualizations are extremely visually appealing to me. They are both extremely neat and colorful, as well as clean and simple. In the screenshots alone, the static visualizations are beautiful.

The “Universe of Emotions” visualization maps together the 307 emotions, showing the different groupings and relationships between the different emotions. The map was created to help people visualize and understand emotional health in order to improve learning and management of emotions.

The map truly speaks to me because emotions are intangible to begin with, yet with this visualization, the different levels and feelings and mental shifts can be simple to follow. The visualization itself is static, which is as Sinclair describes in his article, “aims to produce a single perspective on available information.” Although there aren’t various ways to view the data, which could definitely add depth and different perspectives of the content. However, since the data began as intangible material, the visualization helped to create a very tangible understanding of emotions.

The “Blooming Numbers” visualization, as the author explains, maps out how “people from different cultural backgrounds have distinct opinions about numbers.” To do this, the flowers represent different numbers, with the size being in correspondence to the number of people who chose that number. The colors range from orange to black, where orange corresponds with people favoring that number and black, the opposite. The petals around the flowers represent the people affected by the number.

The dynamic visualizations, which Sinclair describes, “aim to explore available information, often as part of a process that is both sequential and iterative.” The “Blooming Numbers” allows users to interact with the data through clicks, which allows users to explore the information further. When a petal is clicked, the petal links to two other petals from the same person, with additional information about the person. Overall, I think that it presents data in a very different and interesting way, however, I would love to see a simpler way to compare the different preferences across cultures, which seems to have been lost in the beauty of the visualization.


DH Sample Book Example:

“SelfieCity” – http://selfiecity.net/selfiexploratory/

The “SelfieCity” visualization is easily one of my favorite visualizations. For starters, it’s such an interesting idea and concept. The visualization is extremely dynamic and focused on being user friendly, which allows the user to interact and become more familiar with the data. With being able to play with the data and make different connections, the visualization is extremely interactive.

As Sinclair states in his article, “humanities scholarship is often exploratory, we have also come to believe that interactive formats are in most cases preferable to static ones, since they allow the person using the system to add and subtract elements, experiment with different forms, pursue hunches or insights, and so on.” Through further exploring the data, the “Selfiexploratory” can be used to explore demographics, pose, features, and more.

Overall, the dynamic visualizations are super fun and interactive, but the end Findings are fascinating, and overall, SelfieCity does a fantastic job at showing data, analyzing it, and presenting it in user-friendly ways.

Categories
Assignment 1

Assignment 1

What made me choose these two visualizations from VisualComplexity.com was their difference in color usage, word flow, and way of organizing data. Despite discussing two entirely different topics, one is much more interesting to look at than the other. I believe the second image exemplifies a more dynamic visualization whereas the first displays a more static visualization. The first example is a rather plain way of viewing different bridges in a certain area. The area in discussion was two large islands in the middle of a river. These two islands were connected to each other and the river bank by seven bridges. A game that became popular was for citizens to find a way of crossing all seven bridges without repeating. So using mathematical formula, a mathematician determined that it was not possible. Therefore, the second graph is the next best alternative to an otherwise impossible task.

The second graph colorfully explains different beers that are tailored to how someone may like them. Using numbers and factors, each lines connects to another beer that is similar to one that the person may prefer. Running through these numbers and factors, the graph will find the next best beers for the person to try. The only downside to this graph would be the sheer amount of options, making some options hard to read and connections between them difficult to follow. The line thickness also seems to make for some confusing interpretations.

Using the Belfast Group Poetry diagram from the DH Sample Book, I believe it is a better combination of information being presented and the way it is being presented than the previous two samples I chose. Not only is it interactive to see the bond between each person, but it is also clear to understand. Granted, there is still quite a lot of information being represented, it is done so in a way that allows the user to highlight a specific persons name in conjunction to someone else’s name. Looking at information in this way could reveal bonds with people or things that were not previously known based on ideas such as writing style, genre, year published, themes, and many other styles.

Categories
Assignment 1

Kyle Adams Assignment One

Comparison of “The Genealogy of Pop/Rock Music” and “IBM Watson News Explorer”

I chose these visualizations for their collaborative function as exemplar of the fact that networks can manifest themselves in remarkably different ways. When analyzed in tandem, “The Genealogy of Pop/Rock Music” and the “IBM Watson News Explorer” exemplify several distinctions between static and dynamic visualization. As a dynamic visualization, the latter allows individuals to interact with a massive news/media database that simultaneously sorts articles by location, keyword, actors, etc. By giving those engaging with the platform the freedom to “play” with the visualization of sources (ex: alter how they are presented and what is presented) as well as updating information in real time, this IBM interface demonstrates characteristic elements of dynamic visualization that the more static (cannot be altered or “played with” but does include a temporal dimension) musical genealogy does not. Both visualizations, by allowing for the studying of patterns of connections between elements (musicians, news sources, or whatever else) allow data to be viewed in novel ways. However, only the news explorer provides individuals with the opportunity to actively interact with the data in multiple ways (must also keep in mind that the genealogy’s multiple dimensions allow for pluralistic interpretive interaction with data). Although essentially static, the musical genealogy does serve a heuristic function for its ability to depict artistic longevity and influence that may not immediately be apparent to researchers (operates similarly to Priestly’s timeline). The IBM platform utilizes more dynamic qualities to create new knowledge about the interconnectedness of major global figures, organizations, etc. (and even can be used as a way to interrogate the media as an institution). In either case, the visualization does a magnificent job of contributing to novel ways of understanding their fields and many others (understand both relational and attribute data).


Reebee Garofalo’s “The Genealogy of Pop/Rock Music”
Screen Capture of IBM Watson News Explorer


Analysis of “Six Degrees of Francis Bacon”

I selected this visualization based on its direct ties community network designs discussed by Meirelles and Lima. This network visualization entitled “Six Degrees of Francis Bacon” utilizes dynamic characteristics such as a mutable structure and variable presentations of biographical and connective information that can be accessed at the discretion of users (both things static visualizations do not necessarily present). More specifically, this visualization allows users to both interpretively interact with the data as well as more actively mutate the visualization (can be radial, force-directed, etc.). By visualizing myriad informational dimensions and including analytical ambiguity, this community network succeeds in allowing individuals to view the data from different perspectives and arrive at unique and valuable humanistic conclusions. “Six Degrees of Francis Bacon,” much like other community networks we have encountered, effectively contributes to new understanding of intellectual, political, and general social influence in England (shows connections, timelines, biographical information). If this particular visualization did not exist, it would seem nearly impossible to readily generate conclusions regarding the impact or magnitude of this particular social network tethered to its central node, Francis Bacon.


Screen Capture of “Six Degrees of Francis Bacon” Network Visualization


Categories
Assignment 1

Assignment 1 (Colleen Barron)

This busy visualization called “Mapping 31 Days in Iraq” depicts over 800 wartime deaths in January of 2006. I chose this because I felt it was a powerful visualization with emotional sentiment. This visualization is very dependent on its spatial organization. First, the image is separated by spatial regions that stem from the map located in the middle of the visualization. These regions are connected by touching subdivisions of boxes. Secondly, arranging the regions by icons that are moving from left to right and then down signifies the passing of time. Third, the icons represent a variety of victims that help the viewer distinguish who was killed and how they were killed. This is a static visualization because there are no interactive features and limited perspectives. The information is being summarized and is mostly meant to be used as a emotional visual to depict the fatalities of war.

This network shows connections among 19th century newspapers, as well as which texts went viral and why. The circles or nodes represent the newspapers of that time. The lines represent their circulation. The larger the nodes and the thicker the lines means the more viral it was. The colors symbolize communities of closely-tied newspapers. The overall visualization is interactive because you can extract new information from it by clicking and exploring the relationships between the different newspapers, locations, and texts. Clicking on the nodes gives you more information about its connections and the node itself. I chose this because I found it visually appealing and wanted to explore what it represented.


This chord diagram is very aesthetically pleasing. I really like the circular model and the organization of the words because it is very legible. When I explored it more, I realized the circular shape allows the reader to easily follow the chords as they go across in all directions. The thickness and colors are also important to exploring the connections. This is interactive because you can click on connections and names to learn more about them and you can view the groupsheets associated with their names. The lines also fade and highlight when you click. It is not just a summary of information, but a network of people and relationships that can be explored.

Categories
Assignment 1

Assignment #1

1. Invisible Residents

http://www.nytimes.com/interactive/2012/06/19/science/0619-microbiome.html?_r=0

This is a chart from the project called The Human Microbiome Project, which spent two years surveying and classifying the bacteria and microbes at different sites on 242 healthy people. This radial network chart aims to reveal the complexity inside the combinations of microbes living in or on the human body.

The first impression of this graph to me is complex, but After I read through the details of this graph, I was impressed with how this radial network chart manages to embed so much information. Although it is a 2-dimension graph, the circle is actually consisted of three related parts to show many dimensions of information. The inner one is a circle-like family tree of the microbes in the human body; the middle rings shows how much each microbes is found in each site of human body; the peripheral shows the significance of the abundance of each microbes on its most common site. The inner tree graph has classified different kinds of microbes and bacteria, as mentioned in Lima’s chapter 2 (page 62), tree diagram has been popular for its advantage of classification in hierarchy diagram. Therefore, this graph efficiently makes use of the increase the radius to show the information from classification to more detailed numerical charts. It is worth to mention that instead of simply present the graph, this chart uses black border to emphasize significant or extreme values with laconic explanations.

As a static visualization graph, it shows great relationships between each kind of microbes and clear comparisons on the abundance of them. It is regrettable that the this chart don’t provide any interaction for users; I think it would be much better if users can access more details about each branch of data on the graph by a link.

2. Zeus’s Affairs

https://www.fastcodesign.com/1671501/infographic-mapping-every-affair-zeus-ever-had

The topic of this chart is very funny and the result is also amazing; it covers a large part of Greek gods. It shows every relationship Zeus ever had and many of them are with sisters, daughters and aunts.

Usually, relationships of lovers and offspring is presented in a standard top-down family tree, but in Zeus’s case, as the creators says, it would be impossible to represent all the unions between Zeus and other women, with their offspring, without repeating most of the names more than twice. Intuitively, it is a tree graph, but the “center” Zeus is a line instead of an element in graph. It is really interesting that instead of putting Zeus at the center of the circle, the god of gods is represented as a thick black line with his sexual partners on the inside and their offspring on the outside.

This graph of relationships is very interactive. Instead of gathering data only from the popular Homer’s Epic, it covers all texts of Homer, Ovid and many other historians of antiquity, each represented as a different color of line in the graph. Views can click on the color to see only ones delineated by certain historians (The link of the original project is not valid even after I tried after searching).

3.Belfast Group Poetry

http://belfastgroup.digitalscholarship.emory.edu/network/chord/

This is a chord diagram to show the network of relationships among Belfast Group’s members. As an alternate visualization of the original network graph, this diagram is easier for viewers to see the connections and the strength of them.

The strength of each connection between two individuals is represented by the thickness of the line, and the color of the line is based on the stronger or more frequent source of the connection. Compare to the original graph,  this chord diagram reveals more information in each connection and makes the whole network more visible by using different colors and thickness of lines.

This chord diagram is also very interactive; viewers can click on a certain person to see exclude the connection unrelated to him or her, and on the right hand side of the graph, a links of this person’s profile is provided. Sinclair (section Interactive Glyphs) also mentioned that the interactive tools here provide users with deeper insight into many details of the graph. The example provided by Sinclair is also about letters between a group of people; interactive tools provide users with better scope of possible patterns.

Summary

It is obvious that I have intentionally chosen three radial graphs so that I can make some comparisons. All those three graphs aim to show a relationship of network, and it is an advantage of radial graphs, because when elements are highly related, circle provides the better arrangement of elements and lines in visualization. Lima’s chapter 2 (page 62) also mentioned about the popularity of classification with tree method. Although Folksonomy uses bottom-up and DDC uses top-down method, both of them use hierarchy architecture (tree graph). Even though, it is still better to provide the functionality of extracting certain part of the network, especially when the graph is complex and highly connected. All those three graphs have their own good features like multi-dimensions or interactions.

Categories
Assignment 1

Assignment 1

First Visualization
First Visualization

I choose this visualization because it does a fantastic job in dynamic interaction and it looks fancy. “Interactive visualizations, on the other hand, aim to explore available information, often as part of a process that is both sequential and iterative.”(Sinclair, paragraph 2) It is obvious that this visualization provides multiple ways of interaction that can not be fulfilled by static visualization, allowing users to access different information from various perspectives both sequentially and iteratively. Moreover, this visualization uses creative and emergent methods to illustrate the relationship and information in the network. Choosing a center, users can see a relationship network centered with the chosen artist. Clicking on the artist labels, users can further select different options, such as “expand”, “remove” and “create map”. “Expand” and “remove” can increase or reduce the complexity of the network. “Create map” can create a new network centered with the chosen artist. There are different words in the background, which are different attributes that belong to some of the artists in the network. Hovering on these attributes, the artists that have these attributes will be shown, thus providing users with direct and obvious information. Similarly, hovering on artists will lighten the artists’ attributes. To conclude, this visualization provides not only information from different perspectives but also strong interaction.


In order to show some differences between dynamic and static visualizations, I choose this static semantic network visualization as the second one. Although the resolution of the picture is low, it’s easy to see that this visualization uses different dimensions to illustrate information, such as colors of lines, solid or hollow dots and colors of bars. Also, since the visualization is based on a book called “Brave New World”, on the left there is a dimension of different chapters. “For chronological data, the timeline is a venerable visual format, whether manifested statically or interactively.”(Sinclair, paragraph 2) This timeline like feature make this visualization more organized. It is really different from dynamic visualization that static visualization is hard to interact with users. However, clearness and easiness can also make a static visualization helpful and informative.


Third Visualization

For the visualizations in DH Sample Book, I love this visualization most due to it’s easy but nice looking. It is a dynamic visualization that provides various perspectives and fantastic interaction. At first glance, the complex lines may seem to be misleading. However, when hovering on different people, clear relationship will be shown. Furthermore, after clicking them, more text information can be viewed. “That is, some steps come before others, but the researcher may revisit previous steps at a later stage and make different choices, informed by the outcomes produced in the interim.”(Sinclair, paragraph 2) It is evident that users can revisit former steps and make different choices in order to make comparisons and access more information. These interactive, organized and creative ways of understanding the material are really attracting.


Categories
Assignment 1

Assignment #1 Luke Hartman

For the two above visualizations, I found them fascinating for distinctly different reasons. On the left is a picture of a sample visualization from a website (http://rama.inescporto.pt/) that takes musical artists, identifies both characteristics of their music and similar artists based on those characteristics, and then displays the links in a color coded, digital web. It also has a lot of cool interactive features including the ability to click on related artists based on highlighted or selected genres, characteristics, styles etc. and then offers information about selected choices. One can also create radio stations or see music playlists related to any of the items viewable in the chart which I thought was really cool. It reminds me of a visual analyzation of basically what Pandora is trying to assess through one’s thumbs up or down preferences which was very cool to see and may be useful to interact with. I found it to be very effective at accomplishing Stefan Sinclair’s vision for a well-done visualization when he stated, “The humanities approach consists not of converging toward a single interpretation that cannot be challenged but rather of examining the objects of study from as many reasonable and original perspectives as possible to develop convincing interpretation.” This visualization does just that with its user interactivity and lack of boundaries for how to manipulate the data to show different pictures.

The second example above is a much more static visualization. It does not have any way to interact with the data, but it does provide a very detailed and analytical layout for a large amount of qualitative data. As a Palestinian, the culture and stability in the middle east has always been important to me, and like most, it is very difficult for me to understand. While it is not super interactive like many of the other visualizations on this site, I feel that it has a valuable place in promoting understanding about a complex topic. By addressing many topics and clearly showing links between related ideas, it provides a vast amount of knowledge that a reader can analyze. In the Sinclair reading, he proclaims, “a visualization that contributes to new and emergent ways of understanding the material is best.” He talks mostly about how interactive visualizations do this best, but I think this static visualization does it well in this instance because it simply provides facts in an easy to follow way without drawing any conclusions about morality for the reader. It’s a good example of knowing how to present your data in the best way given its content. 


The visualization I chose from the DH sample book is called Kindred Britain. A picture of the general layout is below, but to get a grasp on the value of the visualization, it must be explored in its interactive capacity. It is a network of individuals of British decent, and shows blood relation as well as marriage connections through a lens of historical context. I actually found this visualization to be very difficult to understand. There is interesting material being presented, but it is hard to sort it out and in my opinion the formatting and style could be cleaned up a good bit. As Manuel Lima pointed out in his TED talk that we watched in class, a visualization is only as meaningful as how it speaks to those who are viewing it. I agree with this profoundly. If I can’t understand what’s happening, no matter how intricate and well put-together the data is, I’m still not going to get much out of it. I’m not particularly experienced with in depth data sets, and this makes it more difficult to interpret and make the most of a fairly complex data set such as this.