Categories
Assignment 2

Assignment #2

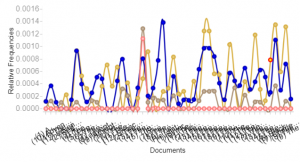
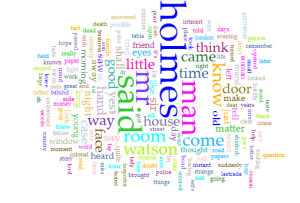
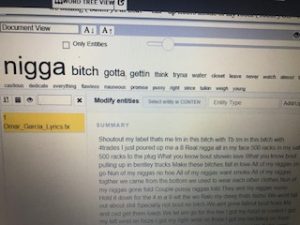
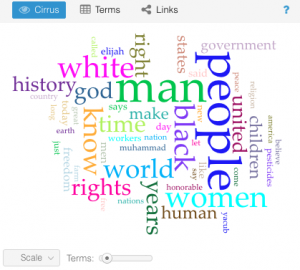
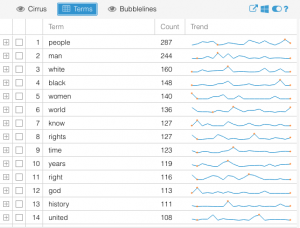
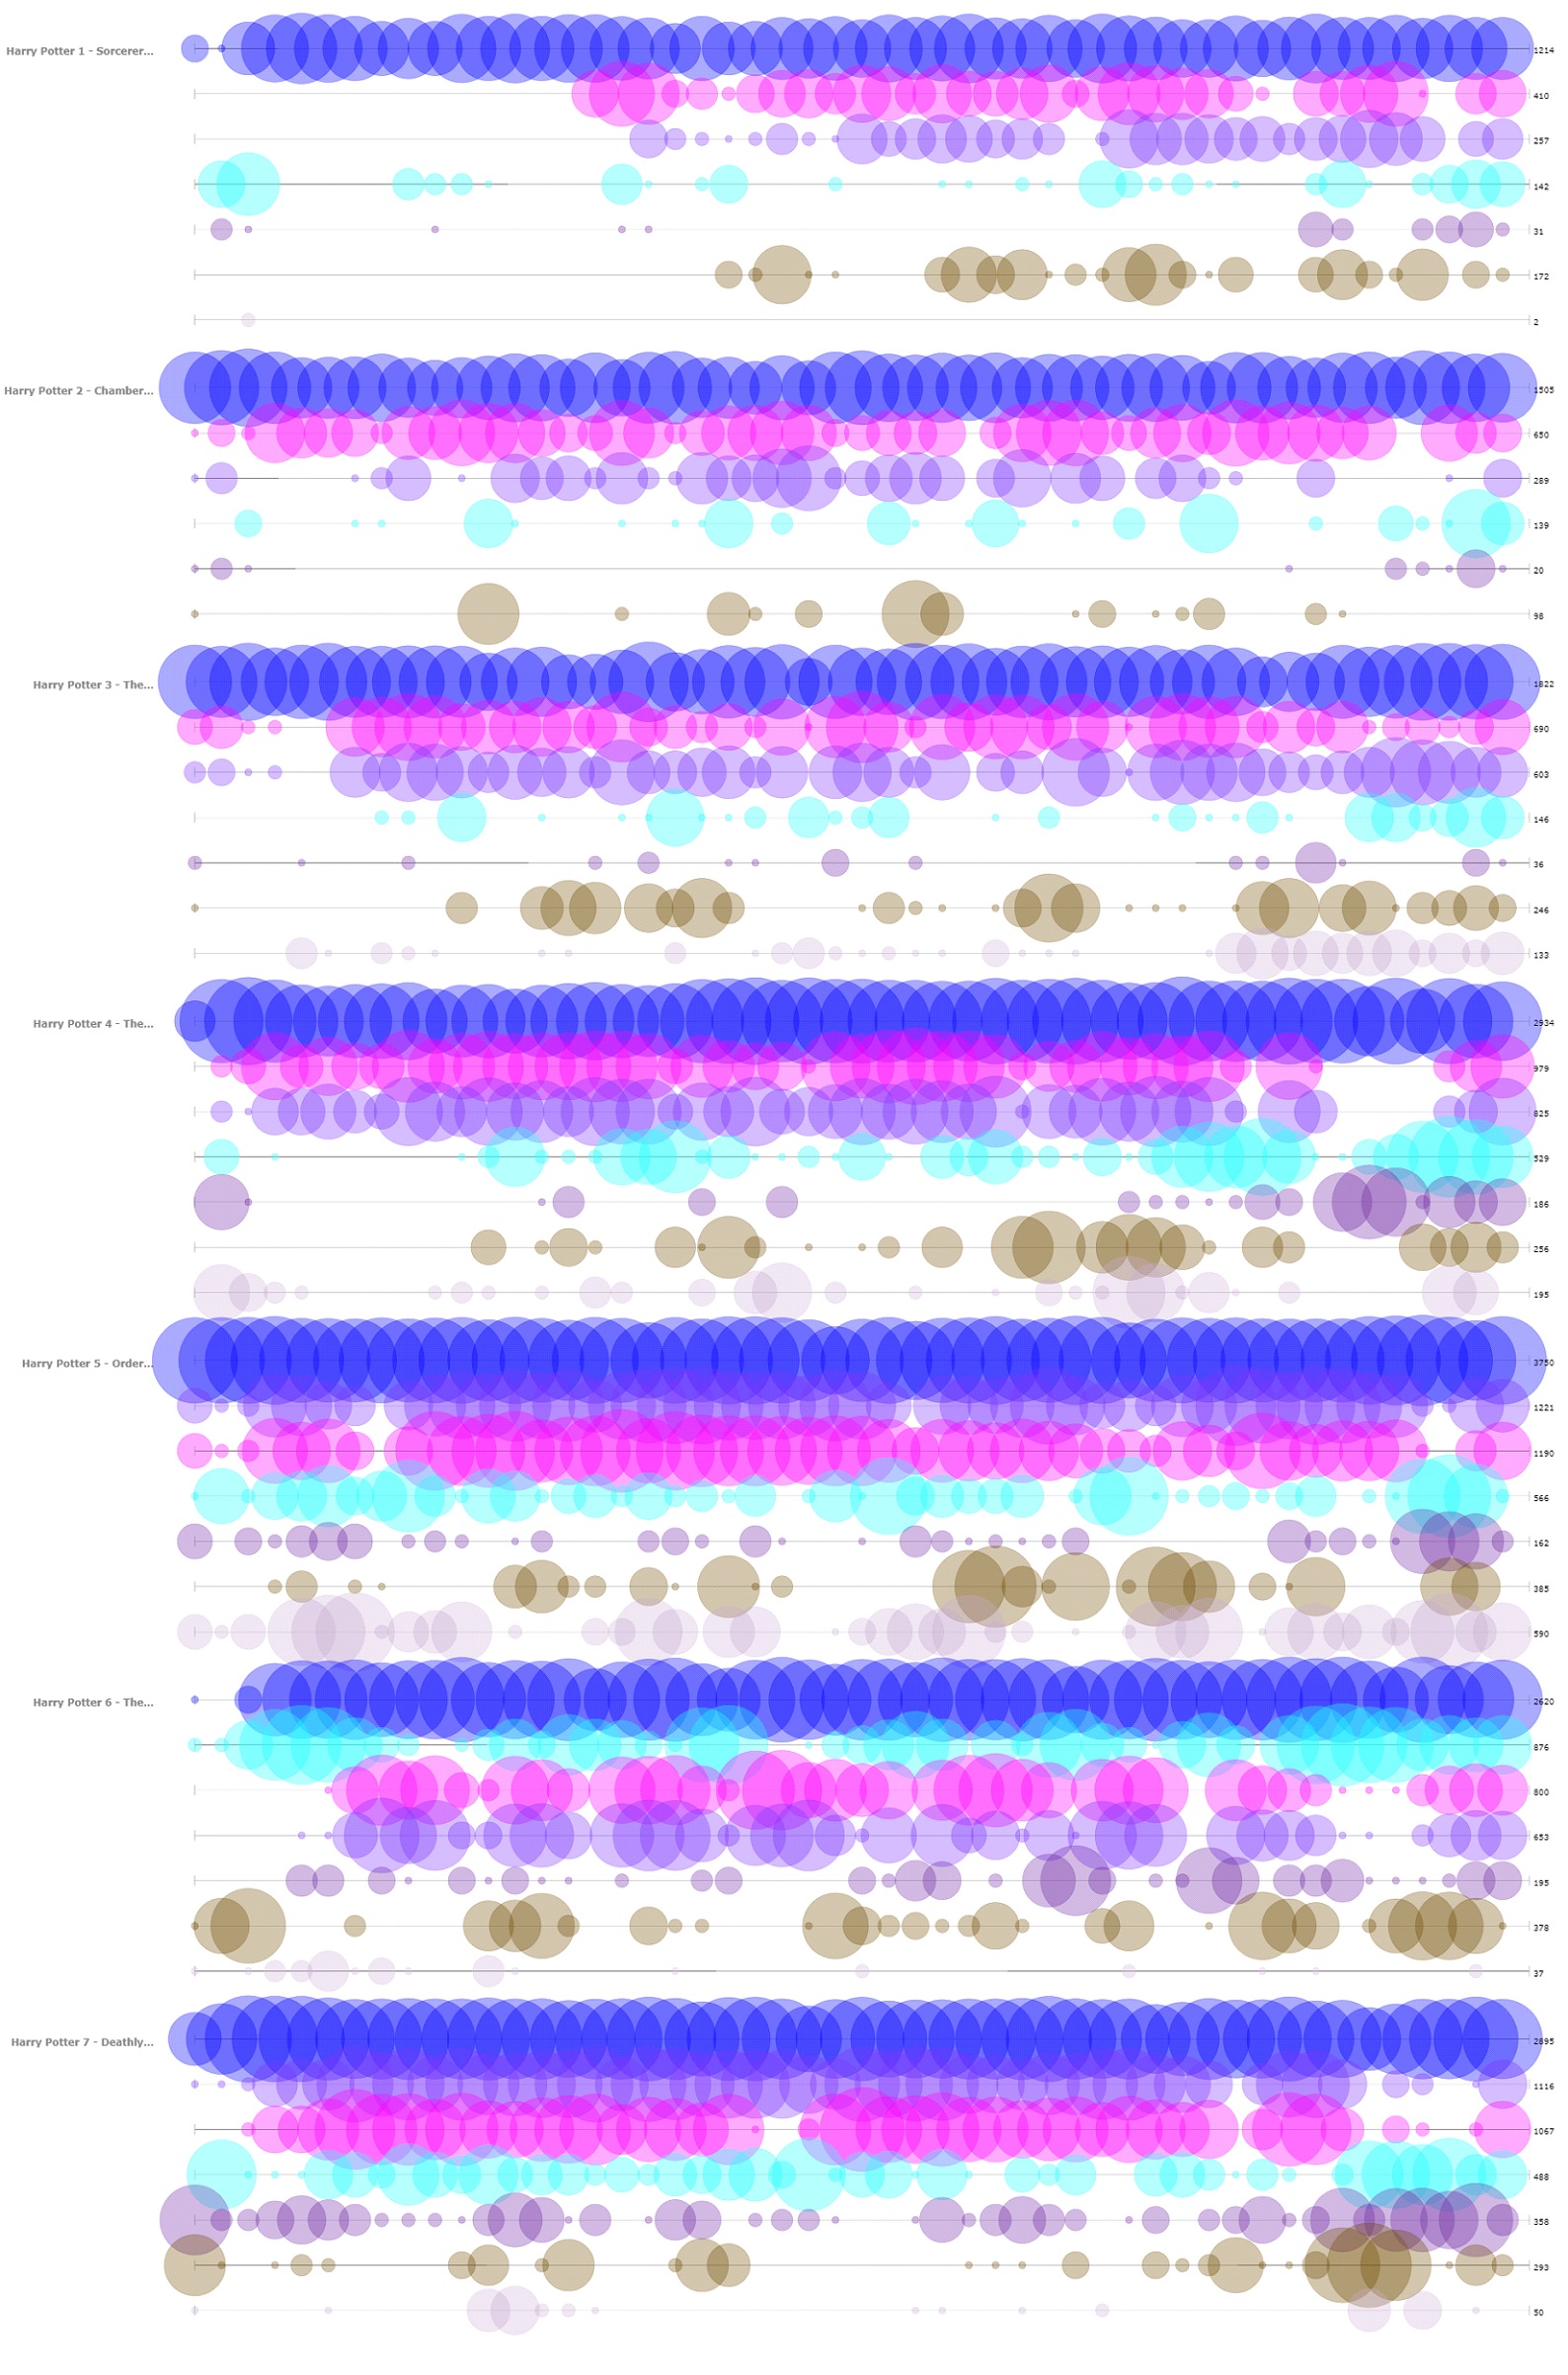
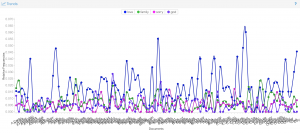
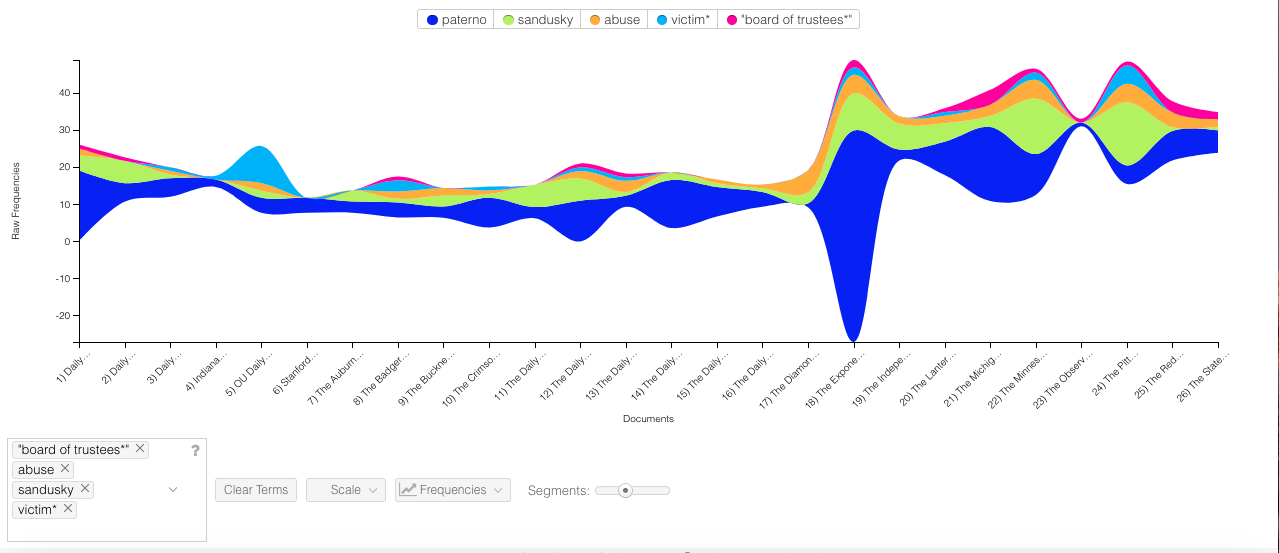
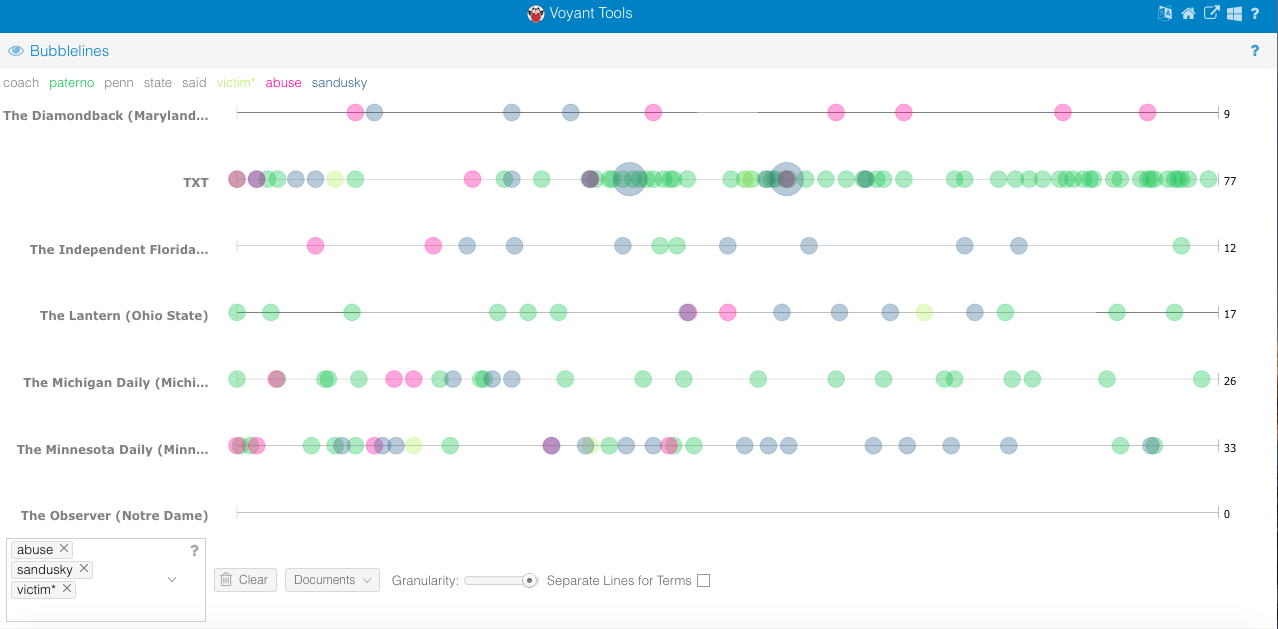
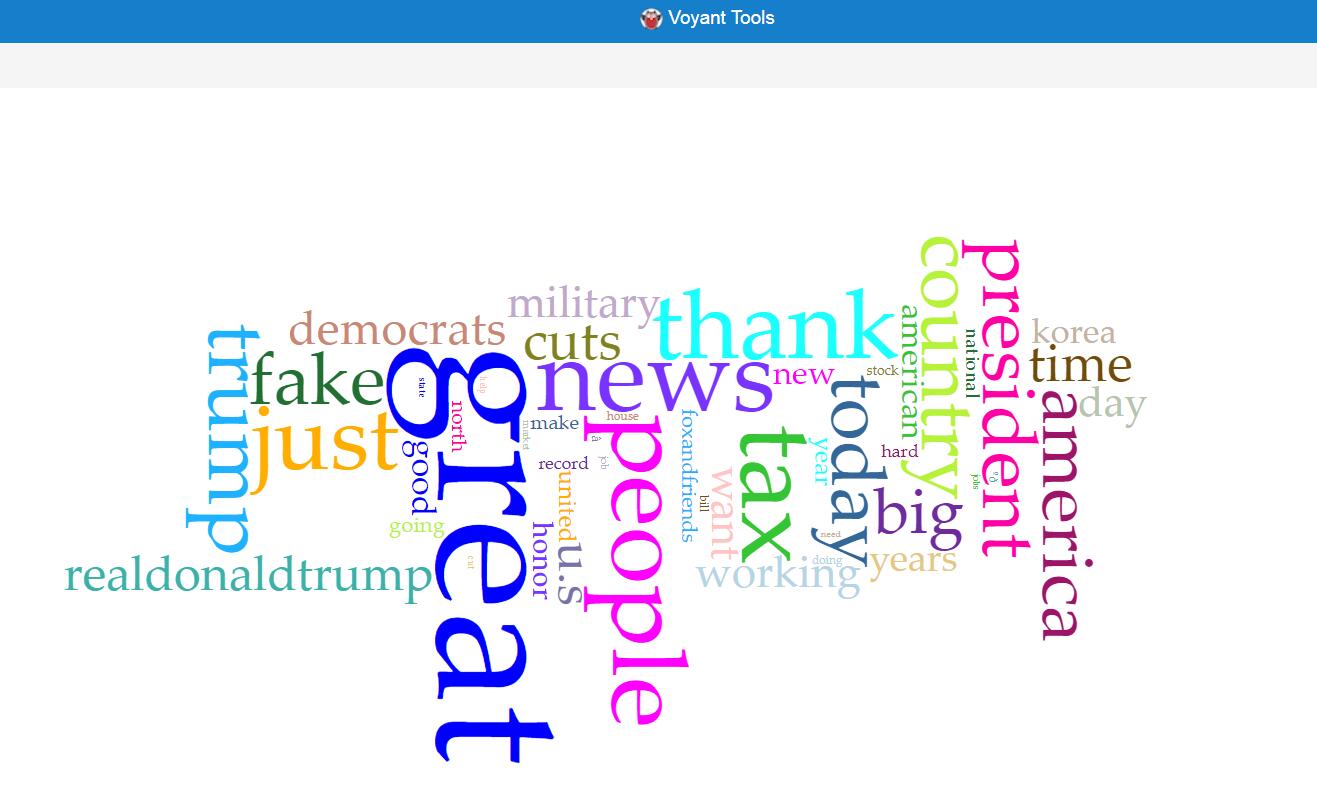
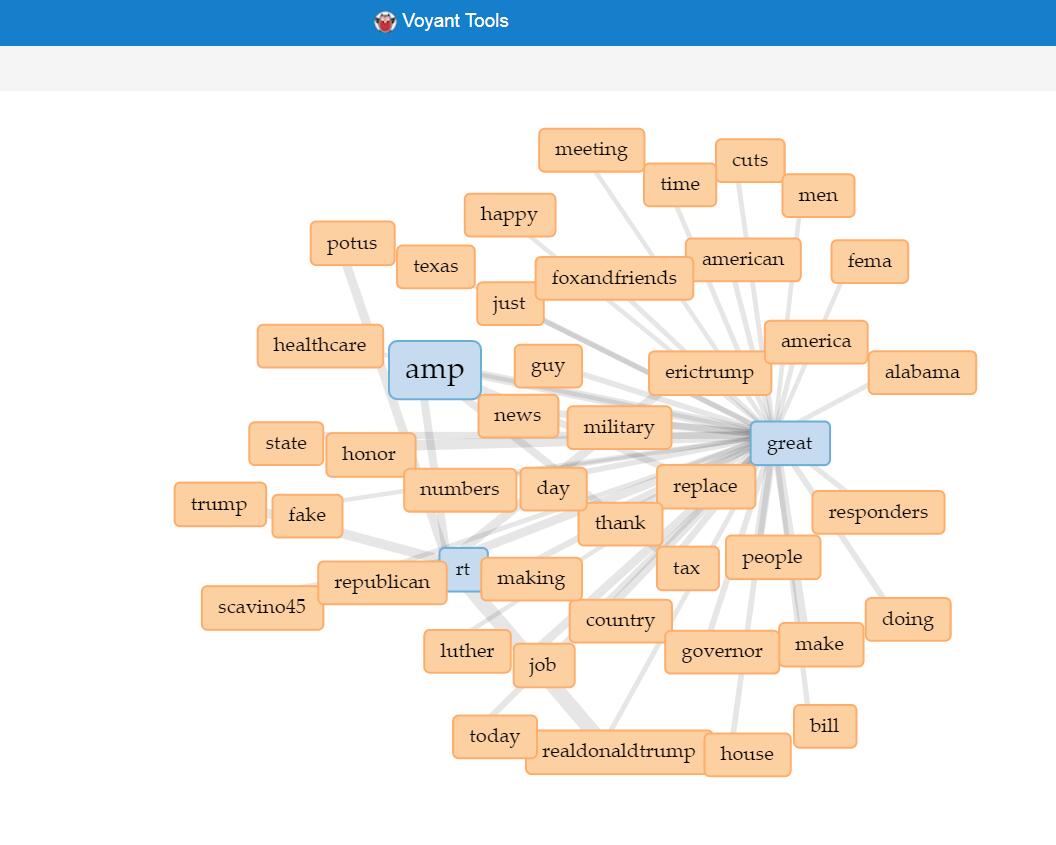
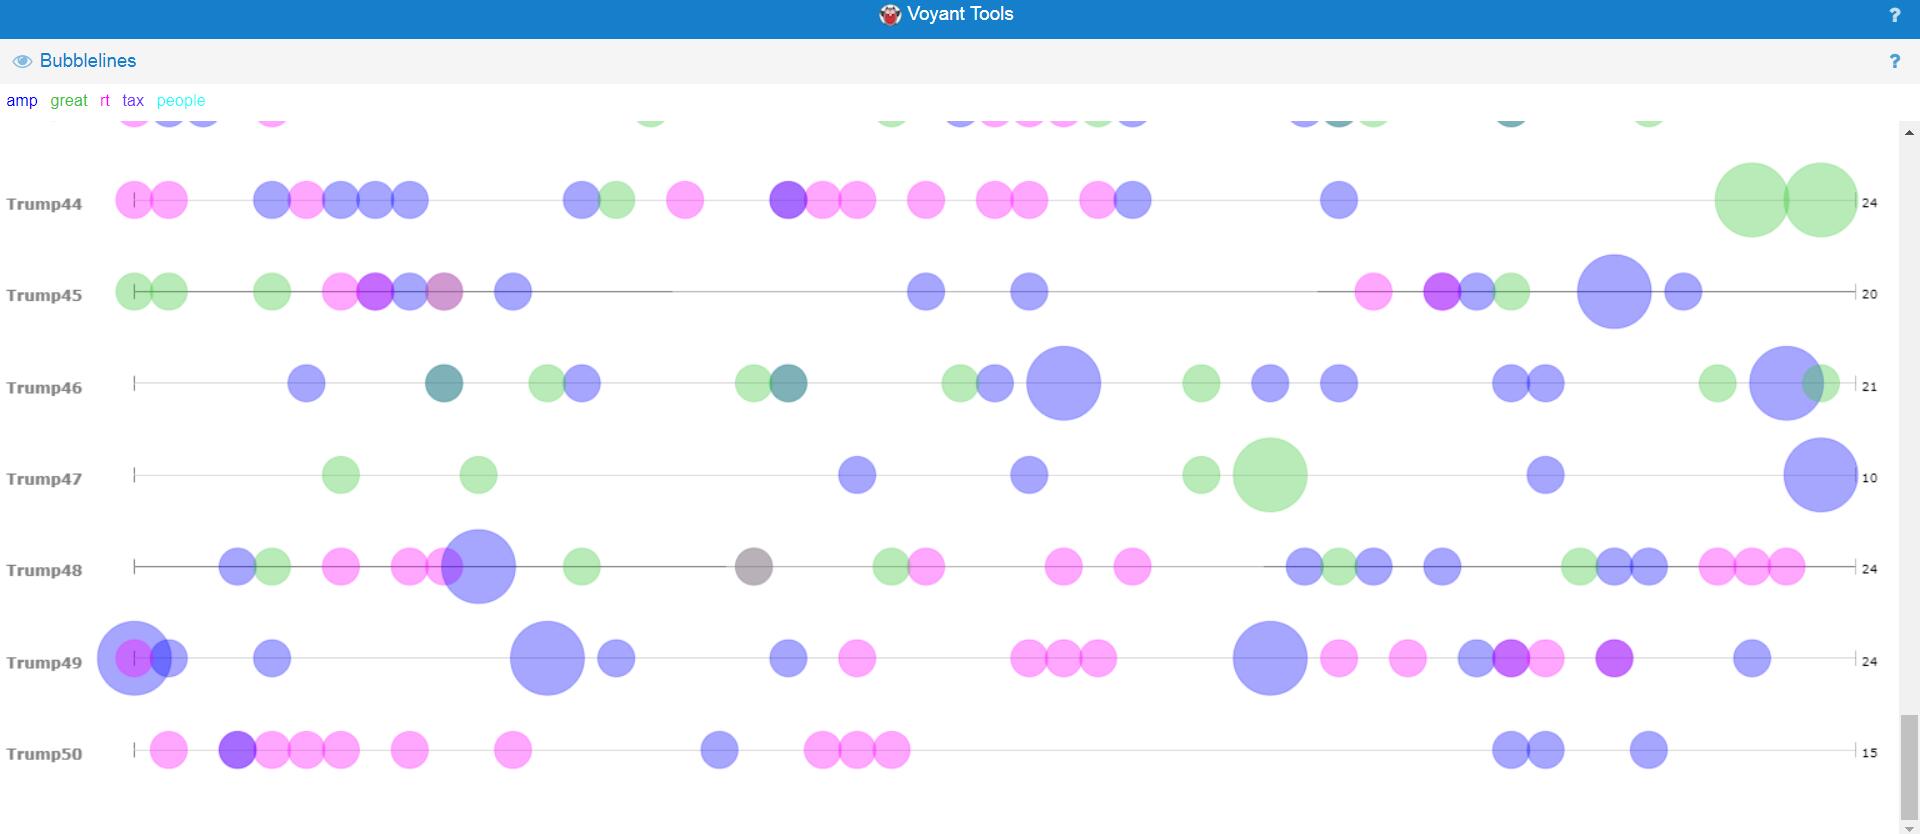
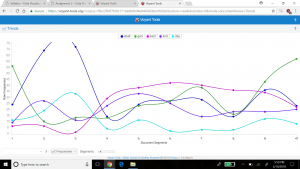
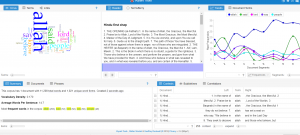
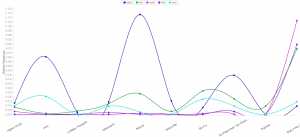
Through the past decades, hip-hop and rap music has evolved into many styles as new groups have formed and changed the culture. Being that music has a major impact on my daily life, I decided to create a song corpus from my favorite tunes/artists. One goal that I want to accomplish is to gain a better understanding of the content that these songs entail. I will be using the albums Culture 2, Young Rich N****, and Too Hard. The corpus artists’ (Migos: Quavo, Offset, Takeoff), Post Malone, Baby, Two Chainz, and Drake) originated all across Atlanta, Toronto, and Syracuse, NY. With New York and Atlanta being popular musical city hotbeds, I felt that this would give a provide an interesting comparison while deciphering the similarities that these artists have while expressing their lives through words. The lyrics include a few explicit words which give my corpus a realistic feeling which reveals the true identity of this genre. My overall corpus construction worked well with both tools as it discovered word frequencies as well as comparisons regarding the main words and phrases. I have used Voyant many times throughout my time at Bucknell and it has been outstanding, to say the least. It allows a viewer to gain a better understanding of the text in a variety of ways and methods. Since there are many options to choose from, the creator isn’t limited to a standard format which helps a corpus true meaning to be shared with the intended audience. I chose Mandala and Trends which connected the words together between songs and highlighted the connection of the song-to-word. Mandala has a clean and basic appearance that vibrantly lights up when you move the cursor across the song title. Trends was a bit different as it displayed the frequency in which the words were being used. This showed revealed the artist’s favorite rhyme scheme or lyrical pattern. 


Mandala (Voyant)

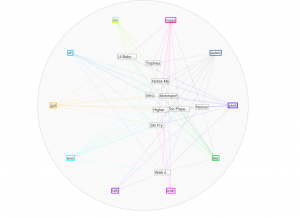
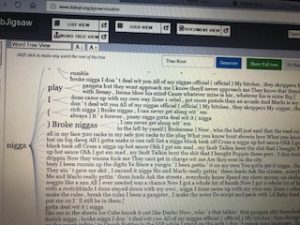
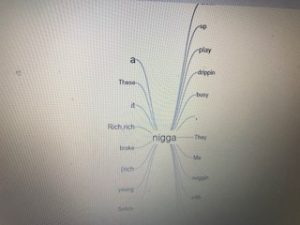
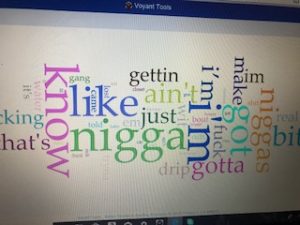
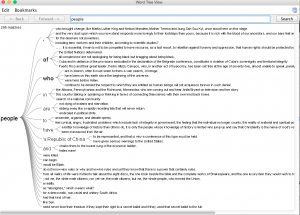
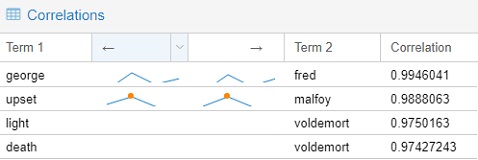
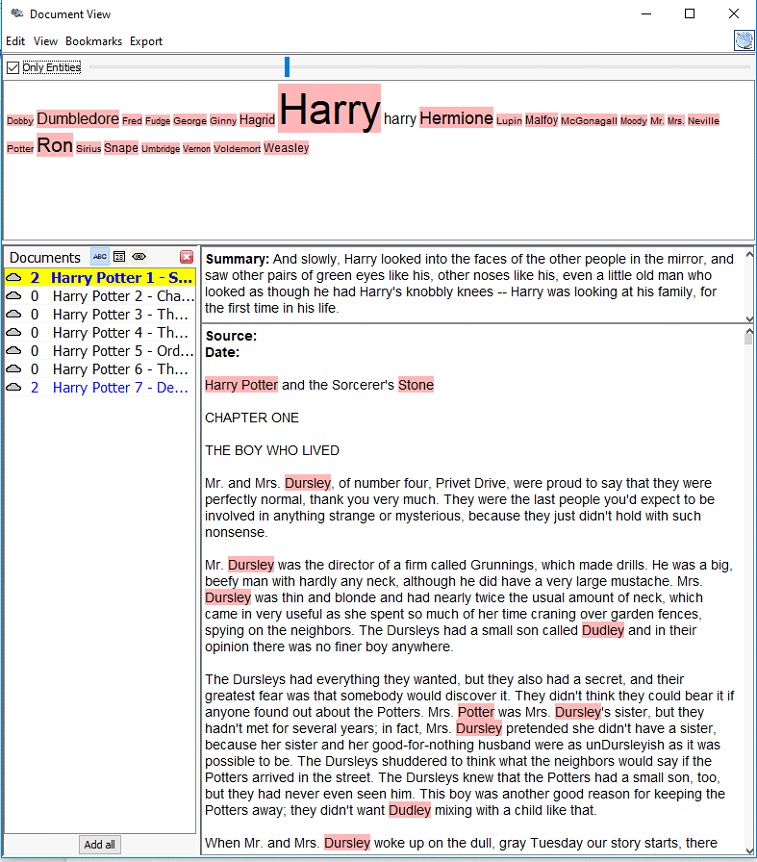
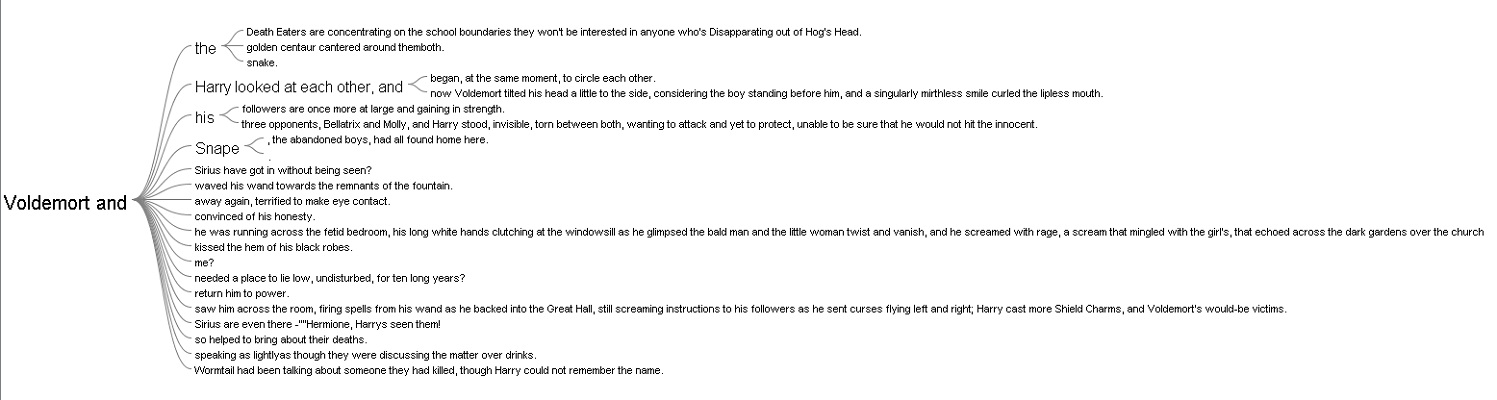
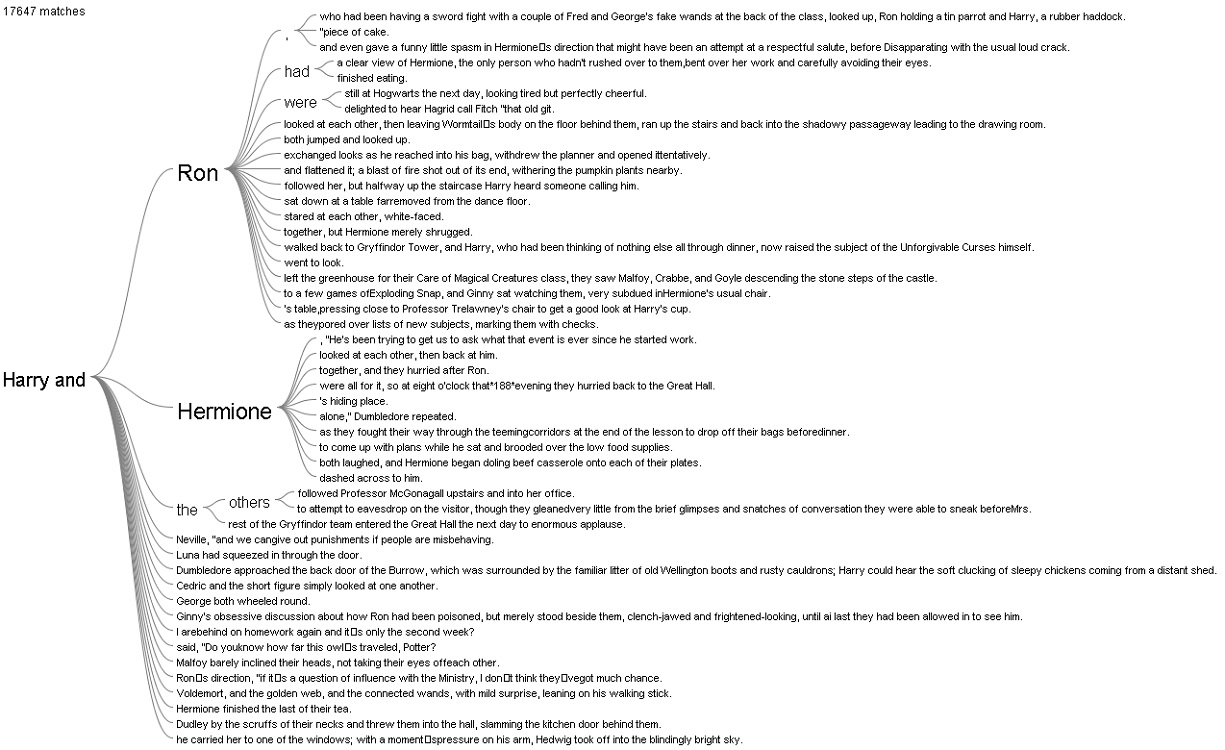
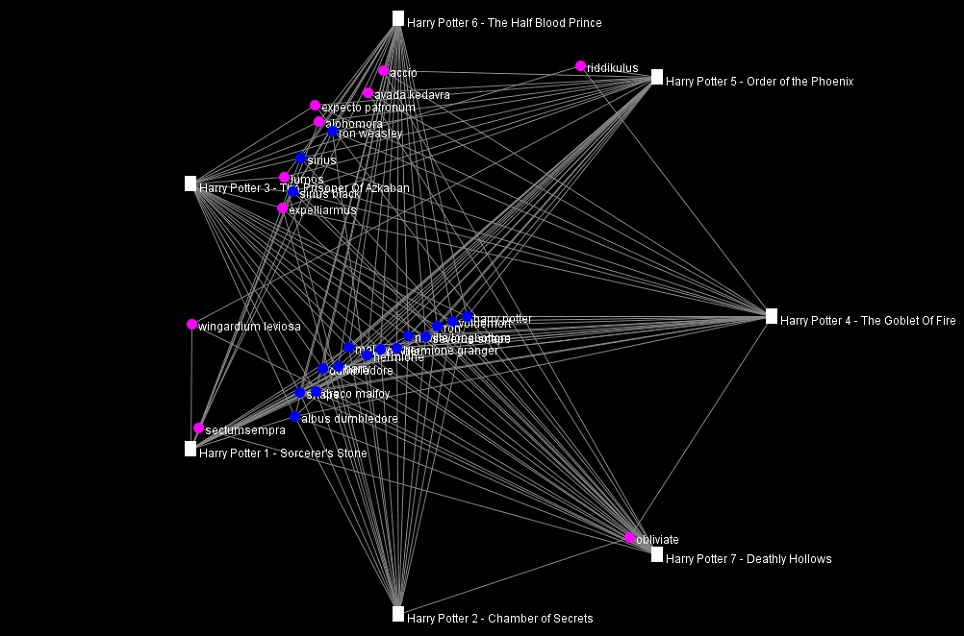
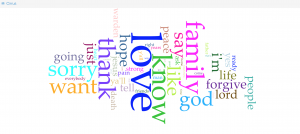
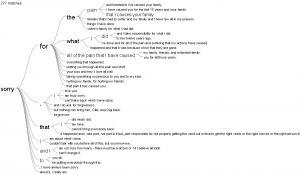
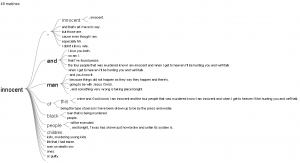
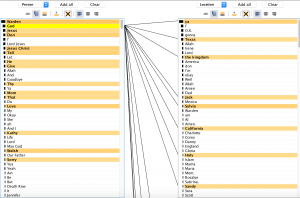
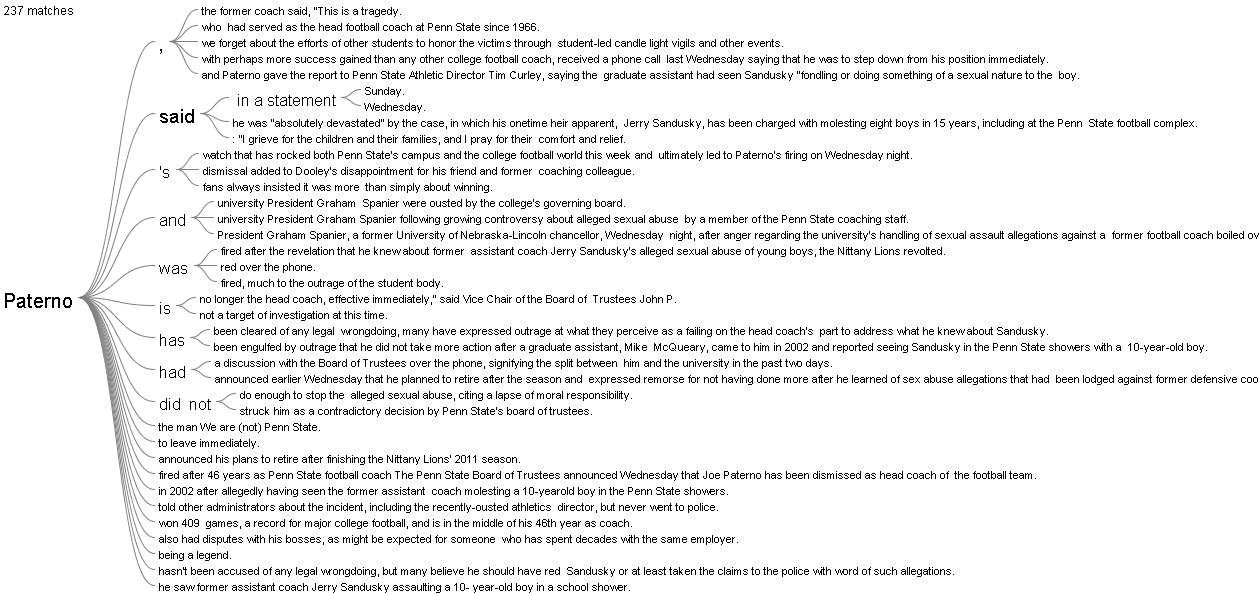
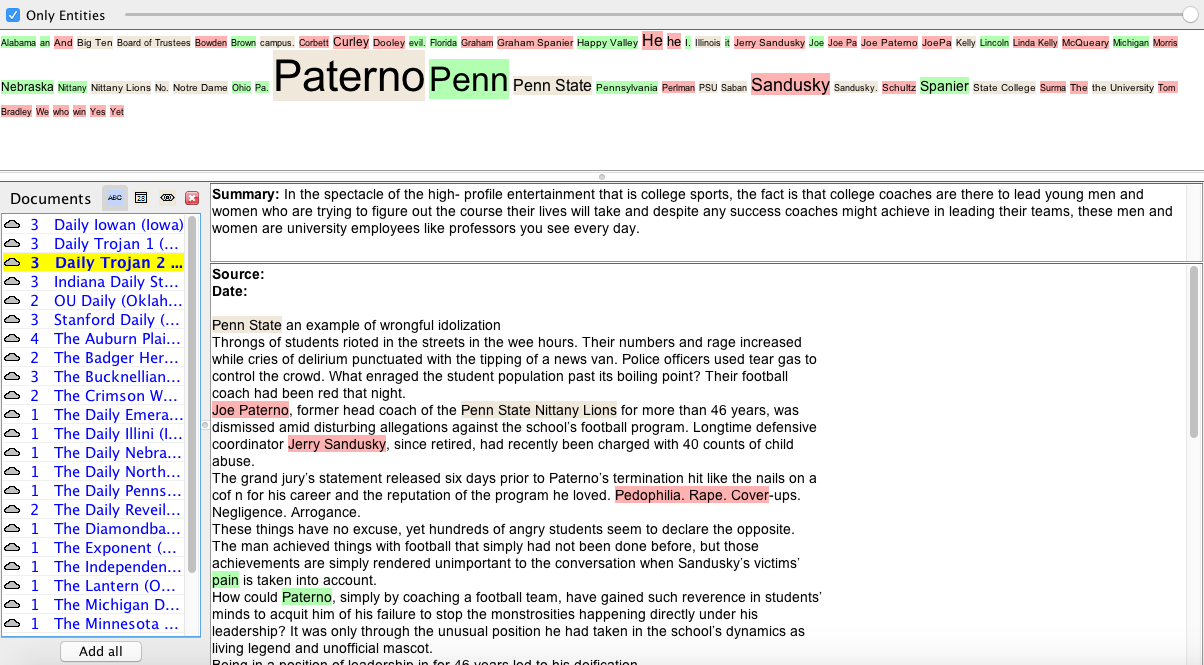
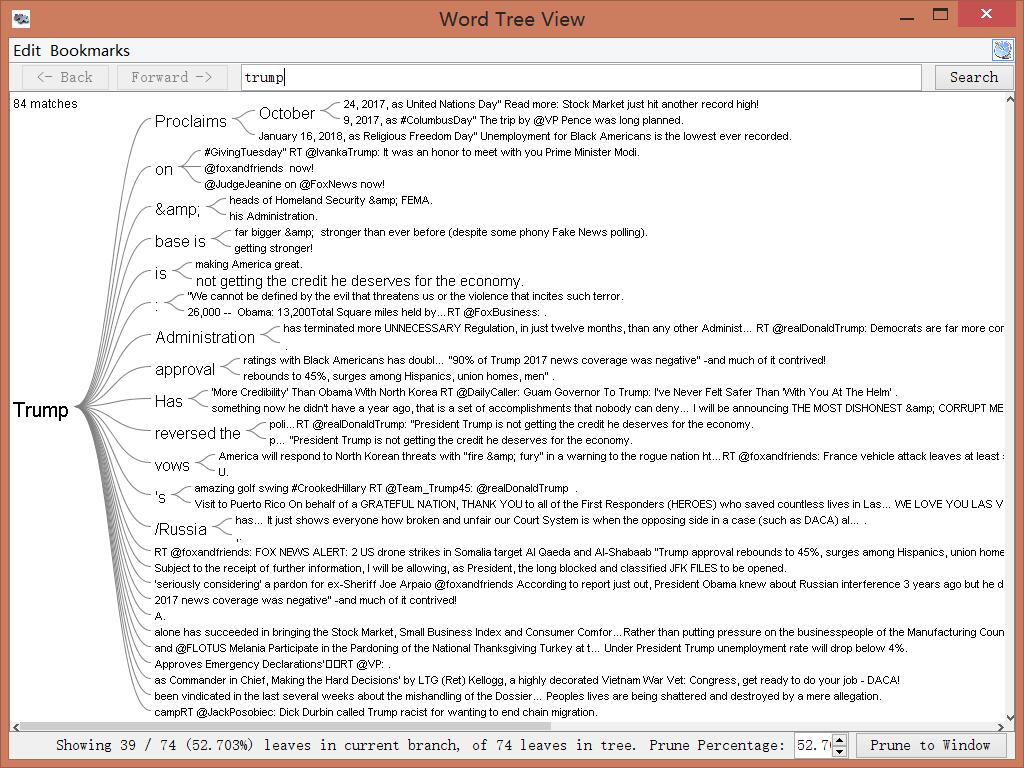
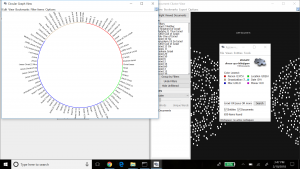
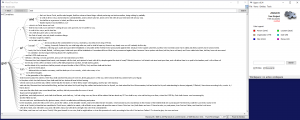
After using both platforms to visualize and analyze the corpus, I can see that they both have many similarities between the two, however, they are very much different at the same time. Using the Word Tree file in Jigsaw, I highlighted “money” as the keyword which is a common topic of discussion regarding the dream rap artist lifestyle. Voyant showed me the similar linked words to money within a song. Jigsaw actually connected phrases and linkage which created an extensive amount of data. It showed an artists lifestyle, his goals and what his future plans would be with the money, also about the violence surrounding their life in order to generate and maintain this currency. It’s also as if it goes deeper than the surface of a lyrical pad and actually tells a story of its own in a unique way. This connects an audience to an artist life which they can then relate it towards their own personal life. By using Jigsaw, it’s possible to reveal similarities that you’ve never known about an artist. For instance, in the Migos’ project Young Rich N*****, this was the early stage in their careers where it was understandable that they showed immaturity in their raps as they related money back to strip clubs and drugs. However, their Culture 2 album showed that money related to conducting businesses, establishing great credit, and creating lives for their family members. Both platforms effectively conveyed forms of a relationship between artist and style/slang. Mandala revealed that the terms ‘yea’ and ‘woo’ where the most found terms which are interesting because, at the end of many verses, the artists use those words as ad-libs to transition into the next verse or stanza. This contributes to the melodic vibe that’s created when making this kind of music.

Trends (Voyant)

Ultimately, this corpus construction and visualizations has further supported Tanya Clement’s observation’s as I was able to create “multidimensional viewpoint” by using the tools. Instead of being stuck in one category, these platforms have allowed the viewer to analyze an artist beyond the lyrics while actually using the content given in their songs. It’s very ironic that these songs have come to life while never actually having the livelihood, to begin with. It now jumps off of the paper and into our minds where we can now view information from all different angles. Also, using these tools strips the narrative or delivery from data and only shows textual word. Both platforms invite the viewer to analyze and interpret data in a creative way which wouldn’t be possible by just an ordinary viewing.


Word Tree (Jigsaw)


Categories
Assignment 2

Assignment 2

I chose to analyze the original Sherlock Holmes short stories by Conan Doyle. The idea came from our analysis of the London map in class the week before this assignment. I’ve omitted the novels in an attempt to keep the corpus even throughout. I feel the short stories were an excellent choice of corpus for this assignment, namely for Jigsaw. Doyle released the adventures in collections, making them fit for classification throughout the years, furthermore they each have roughly ten entries which is perfect for Jigsaw. In this way it was very easy to decide which texts I should use, as they could all be used fairly easily. Additionally the short stories are close to 10 pages, which makes Jigsaw far more useful. All of these factors helped in choosing Sherlock Holmes for a corpus. I’ve chosen to analyze Doyle’s writing style as the stories got older, and if he tried to tailor his style to meet demand as time went on.

Collecting the corpus was fairly simple. Being such an old series of works, they were all available free online. I found plain text versions of each work and copied them all into their respective categories. From there I went to Jigsaw.


My first visualization is of the words relating to the works over time. As you can see here, this visualization is representative of time and length of the works individually. The lighter the color the shorter the work and time runs left to right. As you can see length appears to be lessening as time goes on. We can interpret this as assuming maybe his works were too long for the average consumer. Seeing that, maybe he adjusted the length to maximize the audience. Or maybe he got better at writing and could convey more with less writing. That is what we can take away from this.


Our second example jumps to voyant. This visualization shows the frequency of dark subject matter showing up within the texts. These terms include murder, death, and killed among other terms. As you can see the frequency of these terms tends to jump around with spikes throughout. One could interpret it to see there is greater grouping in the middle of this writing. The documents are grouped by work and the groups go from left to right in terms of time.

My final visualization is a simple overall word frequency of the Sherlock Holmes short stories. While it doesn’t entirely line up with my original plan, I felt that it was interesting how static and representative of the time that this was written in. Holmes blows all the other terms out of the water, despite the books having a wide cast of recurring characters. The short stories never fail to have Holmes being the center of the show with the side cast of characters merely filling out the world, and Doyle never moves from that philosophy throughout.


These two tools are extremely powerful and can generate amazing visualizations. I feel that voyant can create very good visualizations that can be dynamic and are interesting for the viewer, however its power lies in accessibility. The ease that one can create visualizations with is incredible. Jigsaw on the other hand has an incredible skill ceiling. With enough skill one could make visualizations that blow voyant out of the water. However, it is much more difficult to even get jigsaw off the ground. As such, voyant was a joy to work with, while jigsaw was very difficult.


I feel Clement’s quote is very much reinforced by what I’ve done here. Certain opinions or conclusions that could be drawn from this data could not really be seen from a simple reading. Jigsaw and Voyant allow for a incredibly deep analysis from seemingly infinite angles. That overlap that creates a ‘multidimensional’ lens is why I find these tools so powerful. Different visualizations could show vastly different things, and even within one you could come to a myriad of conclusions.

Categories
Assignment 2

Assignment #2

For my corpus, since I’m interested in music, I’ve decided to focus my research on the lyrics of some of the artist I like to listen to. I grew an interest in music because I find it as a way to express oneself. I’ve realized this is a very broad topic so instead, I choose songs that have some type of correlation, rap. I then went on to Genius and copy and pasted my top 10 songs and put them in a single word document. With the text, I gathered I hope to find similarities between these songs whether it’s the deeper message the artist is portraying, commonly used words, or to analyze and see if their flows are the same. At first, I was going to censor the explicit words from these songs however I felt that was taking away from the authenticity of these raps. I want the viewers of my corpus to get a sense of what artist are rapping about today whether it’s money, drugs, women, etc.

Unfortunately trying to download jigsaw to my computer has been a mess this past couple of weeks. My system since trying to download the program has not been right since. So for the assignment write up, I’m currently using WebJigsaw. I realize not using the original jigsaw I’m not able to see the many interactive visualizations however it still provides me with the word tree, list, and document grid views.

Nonetheless, from interacting with these two visualizations I’ve realized they are quite similar. However rather than just being user-friendly and more appealing like Voyant, Jigsaw takes it a step further by using visualizations that show connections between entities across the document collection.

Both tools have a word tree visualization, however, spits out different information when searching for the same root term. The term ”ni**a” was used both in voyant and jigsaw to show an example of this. On the one hand, when using voyant to search for a term you are able to click on the term your searching and it will allow the viewer to explore the root term and the different phrases its used in throughout the corpus. On the other hand, when a person is using jigsaw’s wordtree the viewer is able to search for a term and it will turn show you the entire phrase that follows the word your searching for as well as highlight/bold words that are used more frequently throughout your corpus.

Furthermore, both tools have similar visualizations that enable the viewer to see the top frequent words being used in the document. This tool is used to quickly draw the attention of the viewers to show them what is in the document. With voyant, this tool is called cirrus which uses a method where the most commonly used words are positioned in the middle emphasized with larger text and the less frequently used words are on the outside hovering around. In a jigsaw, this tool is called the document view which has all the traits that cirrus has but you can take it a step further by analyzing the similarity of your documents against the others being visualized in addition you can request that the document execute a sentiment analysis.

By constructing my corpus and viewing it through both visualization tools: voyant and jigsaw I believe it gave me a different perspective. This, in turn, agrees with what Tanya Clements harped on when she talked about multi-viewpoints. Even though I wasn’t able to use the original jigsaw format I got the sense of how powerful of a tool the program really was through WebJigsaw. What drew my attention from using both visualizations were how interactive they both were in using my corpus. Using both visualizations I was able to catch things that the human eye might not. I was able to break down the information and get a better sense of the lyrics of my favorite songs.

Categories
Uncategorized

Assignment 2 Luke

a.) My corpus is from one of the pre-packaged sets that Professor Faull gave us as an example. While this may seem like an easy way out, I have always had a vested interest in civil rights. Growing up in Birmingham, Alabama, and having grandparents who lived there during the 1950’s, I have always been interested in the civil rights movement in the United States. Also, I am half Palestinian. My grandfather on my mom’s side came to the U.S from Ramallah Palestine when he was 15 after his family was removed from his house at gunpoint by militants. Having been told his story from a young age, the issue of human rights has always been one I have been passionate about. All of this being said, I am still working on adding to my corpus, but for now I spent a good amount of time analyzing what I have in Voyant and Jigsaw.

b.) Voyant provides many different ways to interact with a vast amount of text, I had a lot of interesting thoughts while playing with my data input. One of the first tools that shows up when one uploads their corpus is the “Cirrus” tool. It shows a puzzle-like picture of words where size corresponds to frequency of mention within the entire corpus. It gives an idea of what the central words in a piece or a set of works may be, but it is not an end all be all for the message as it’s simply a frequency representation. Below is the Cirrus for my entire corpus.


Another part of Voyant that I found interesting was the “terms” visualization. It shows the most frequently used terms in a list, but then on the side it shows relative frequency and trends for which documents they were most often used in and at what point in those documents. It is shown below as well. I found this very interesting as it’s not necessarily a takeaway one would have or even contemplate when reading the documents themselves.


c.) I found Jigsaw to be interesting in a very different way than Voyant. I felt as though it was pushing me to make connections between aspects of the texts, as well as the individual texts themselves. The word tree tool was fascinating as it allowed me to gain perspective on the context in which words were being used across texts throughout the corpus. For example, below is a screenshot of what happened when I searched the word “People”, which as voyant shows above, is the most often used word throughout the corpus.

As can be seen, this image shows tons of different and unique uses of the word people in the corpus, and even this plethora is only 15% of the total usage overall. I also found the document grid viewer very thought-stimulating as it allowed the user (me) to sort the documents based on importance for a variety of factors.

d.) Maybe I am biased because I have likely spent more time with and have a greater understanding of how to use Voyant, but in my opinion its interface is so much more user friendly than that of Jigsaw. It presents easy to read menus and tools with adjustability of features without having to x-out of one window, research a word, and open a new window to see a new visualization. There are some levels of detailed text analysis that I thought Jigsaw was useful for to supplement the limitations of Voyant, and perhaps those are magnified the deeper one goes into analysis, but I found most of the things I wanted to do on Jigsaw, I could find similar data presentations on Voyant in more user friendly ways.

e.) I think that working with these two platforms has greatly contributed to the “multidimensional viewpoint” as Clement put it. I feel that I have garnered insights about these sets of textual data that I could have never surmised simply from reading each individually. The ability to visualize large sets of the data in quantitative and qualitative graphs, tables, etc. allows for a more comprehensive understanding of the meta characteristics of the corpus. It also sheds light on what may be “plausible truths” about the texts and works that would otherwise go undiscovered.


Categories
Assignment 2

Assignment 2

For this assignment, I chose the Harry Potter series because I wanted to get a different view at the novels I like so much and hoped to find something interesting. So, I googled the .txt version of the books and saved each of them as a separate .txt file.

First, I loaded the books in Voyant. After trying many tools provided by the application, I found the Cirrus, Bubblelines, and Correlations tools to be the most fascinating.

Obviously, as the titles of the books suggested, since the series is about Harry Potter, the most prominent word in the Cirrus visualization is “Harry.”  Predictably, the second, third, and fourth used words are “Ron”, “Hermione”, and “Dumbledore” respectively, all of whom are Harry’s best friends. In addition, since the story is told from a third person perspective, the word “said” is also repeated many times. Even though I am quite against using word clouds as statistical analysis tools because of the lie factor, word clouds such as this one can provide viewers with an overview of the main theme of a text.

The next tool that I found insightful from Voyant is the Bubblelines tool. I used the name of the characters that appeared in the word cloud and a few more that I thought were important as keywords. The result, more or less, summarizes the plot of the series, as one can infer from the visualization the change in importance, disappearance, etc. of the characters.

The final tools that I chose to include from Voyant is the Correlations tool. Although I think the tool might not be as visually impressive as the Bubblelines tool, it was quite entertaining to use. For example, I found that “Malfoy” was highly correlated with “upset”, “Voldemort” with “death”, “Fred” with “George.” Even though correlation is not equivalent to causation, I think this tool still can be very useful for finding trends if the users know what they are looking for.

Importing the .txt files into Jigsaw was more troublesome than importing those into Voyant since the way the books were formatted was not recommended by the author of Jigsaw. I took quite a while to import one out of the seven books at first, so I had to modify the commands to give the program more memory to run with. I imported the books in using the Illinois-NER entity identification, but the result was a quite messy. Thus, I ended up creating my own lists of characters and some spells for exploring purpose. The tools that I found the most helpful were Document view and the Word Tree.

The Document view, similar to the Cirrus tool in Voyant, provides users with the most frequently used words in a document. However, instead of creating a word cloud, the Document view presents the words in a line with varying font sizes to reflect the frequency and in context. It also attempts to give a summary of the text by picking out a sentence from the text itself, which is quite fascinating in my opinion.

The Word Tree provided me with an interesting interpretation. I looked up the words “Harry” and “Voldemort” and clicked on the “and” branch for both of them. For “Harry and”, the most frequently paired terms are “Ron” and “Hermione,” while for “Voldemort and,” there was not a particular name standing out, which reflects that Harry always had his best friends to support him and Voldemort was always alone.   

I also tried out the other views in Jigsaw, but they did not provide anything helpful with the entities I defined.

Overall, I prefer Voyant to Jigsaw because of its performance and usability. The tools in Voyant are very powerful and easy to use since they have tooltips explaining what each tool does. In additional, the visualizations that these tools produced are visually pleasing and smoothly interactive. In addition, I think the Summary and the Context tools in Voyant do better job at summarizing the text compared to the Document view in Jigsaw. However, I do like the idea of importing text with defined entities in Jigsaw since the program is all about visualizing relations. Voyant can also do similar things with links, but it requires the users to know what they want to look for beforehand.

The process of making my own visualizations in Voyant and Jigsaw has verified Tanya Clement’s observation. Modern day computers are not at a complex state where they can comprehend and interpret humanities works. However, what they can do is to provide the computational power to present humanist data efficiently and uniquely compared to humans iteratively reading through printed media. These representations of data by computers, on other hand, do not necessarily provide a fixed view on the data itself, but rather observations that are both objective and subjective.

Categories
Assignment 2

Assignment 2

For this assignment, I decided to look at the last words of all death row inmates in Texas from 1982 to now. Although I knew working with this corpus would be depressing, being able to analyze their last words was extremely interesting and it gave me valuable insight into their experiences on death row. Creating my corpus was extremely tedious because the website where I acquired all the information was separated into over 548 links. I tried to use web scraping tools, but was not able to figure out how to arrange the data in a way that would upload to Jigsaw so I decided to put all the information into separate TextEdit files myself. This took me a long time to do, but it all worked out in the end!

First, I analyzed the corpus through Voyant. This was very interesting to look at because the Cirrus tool allowed me to see the most commonly used words. I noticed that they are all positive words that focus on relationships of some sort, whether that relationship is with family, a friend, or a religion. I found it strange that many of the prisoners said thank you in their last words given their situation (I noticed this as I was reading through the last words during the construction of my corpus as well). The Trends tool allowed me to visualize the patterns of the last words more easily. The relative frequency for words like “family” and “love” were much higher than repentant words such as “sorry”. Looking at the trends led me to believe that the prisoners focused more on reaffirming their love one last time rather than focusing on what they did in the past that led to that moment. I think this shows that many of the prisoners significantly change as they await their death to the point where they are almost completely different people when their execution date comes along.


Next, I used Jigsaw. I really liked the Word Tree view and the List view. I tested out several different words in the Word Tree view and was able to better understand the context and the meaning intended by the different prisoners. I thought it would be interesting to look at the word “innocent” because it was not very common. If prisoners were using their final moment to state their innocence, I concluded it was because they were either innocent or they were lying and therefore have not come to terms with their crimes like so many of the others had. I also used the List view, which was interesting because it showed the connections between the entities as well as the frequencies. This tool really highlighted the prisoners’ acknowledgment of various faiths and their hope for an afterlife. This helped me better understand the context and the relationship between the words they chose. I liked that this view was interactive and allowed you to look at the information in a variety of ways.

I had very different experiences working with these two different platforms. I thought Voyant was very easy to use. I like that Voyant has a lot of different tools that you can choose from, however there were several that I felt were not useful because they were visually incomprehensible or because they just didn’t provide a valuable organization of the data. I think there are still several very valuable tools and I enjoyed reading through the information breakdown below the visualizations as well. I like Jigsaw because of how different each of the 10 tools are. I think they are extremely valuable in looking at the data from new perspectives and seeing connections you would otherwise miss. There are views similar to Voyant’s tools, but there are also several that are very unique, complex, and interactive. I felt like I had more control.

Finally, creating this corpus and viewing it through Voyant and Jigsaw has affirmed Clement’s observation of this “multidimensional viewpoint”. I was very surprised at how the many different ways I visualized the data shaped my interpretation of the inmates’ last words. Throughout the process, I drew conclusions that I did not come to when I initially read their last words. I was able to better grasp that these data analytics methods make the information more objective and allow you to see the information in its rawest form, but that seeing it in its rawest form created even more complex connections.

Categories
Assignment 2

Adams Assignment Two

Working with Jigsaw and Voyant

a.) After accepting the fact that corpus construction and visualization was, indeed, an iterative process (and that I would have to add nuance to my corpus throughout the semester), I decided to begin collecting journalistic articles from university newspapers regarding the firing of Joe Paterno. Although it appears that each article does not necessarily focus on Paterno’s firing, I decided it would be interesting to incorporate each publication’s first mention of the event (whether that was the overt focus of the article or not). I chose to gather articles from institutions that are connected to Penn State University either by proximity (UPenn, Bucknell, Pitt), athletic conference affiliation (Ohio State, Michigan, etc.), or level of football prestige (Oklahoma, Georgia, etc.). As my research with this corpus continues, I hope to remain cognizant of the subjectivity lurking behind article selection. My role as an archival author is just one factor that allows for the visualizations produced from my corpus to remain perspectival (simply by adding technology into the equation, essentialist understandings of this journalistic prose cannot be reached).


b.) Throughout my time working with the Voyant platform, I have appreciated it not only for its ability to foster more intimate understanding of meaningful entities, but also provide individuals with the opportunity to easily generate comparative research questions at the document level. In the two Voyant visualizations embedded (one being a Bubblelines visualization and the other a StreamGraph) one can begin to analyze occurrences of key entities as they relate to one another within specific documents and in the corpus as a whole. In particular, the raw word frequencies displayed in the StreamGraph visualization allowed me to to understand how different university news outlets framed the Paterno firing (ex: some did not even mention the board responsible for his firing and others). Two other interesting conclusions that can be drawn from the visualizations are that the victims of Sandusky’s abuse (the cover-up of which led to Paterno’s demise) rarely appear in this journalistic prose, but also that external campus news outlets (non-State College) do not shy away from connecting Paterno and Sandusky, leading to an implicit association shrouded in negativity.


c.) One of the most meaningful visualizations I was able to produce using the Jigsaw platform was the WordTree displaying appearances of “Paterno” throughout my corpus. By expanding my capacity for entity contextualization, this tool afforded me the opportunity to begin to discern community level sentiment displayed in nominal data consisting of journalistic prose of publications external to PSU. Meirelles effectively summarizes the value of a WordTree visualization for analysis in her sixth chapter, “Besides preserving the context in which the term occurs, the method also preserves the linear arrangement of the text” (Meirelles 200). While functioning in this way, the WordTree visualization manifests itself as a more intermediate step in distancing oneself from a text. By quickly allowing me to understand the context in which JoePa’s name showed up, the Jigsaw platform helped me to see that university newspapers outside of State College did not shy away from criticizing Joe Paterno for his role in the Sandusky scandal, but also felt the need to show appreciation for his accomplishments as a coach (things that may aid in blinding the Penn State community to his wrongdoing). The image of Jigsaw’s Document View exemplifies the platform’s ability to further remove researchers from their corpus and garner an understanding of entity frequency and classification all while summarizing documents (although the selection of these statements by the program may also be an example of non-objectivity in data provision).


d.) In terms of commonalities, each of these programs has the ability to generate meaningful visualizations that allow for the contextualization of entities (ex: seeing connected words, etc.) and understanding of word frequency (which can be extrapolated to fit perspectival analysis). Obviously, each platform also possesses characteristics which its counterpart lacks. For example, Jigsaw can easily generate visualization of sentiment while Voyant offers remarkably unique and varying visualizations of word frequency (ex: bubble sizes, word sizes, stream width). It has also become rather apparent to me that individuals choosing to work in the Jigsaw platform must have a more intimate understanding of their corpus in order to create visualizations, as more “work” must be done to produce meaningful images. However, once one is familiar with the platform, I am under the impression that Jigsaw allows for more advanced visualization of entity context and document connection. All in all, Voyant provided me a more preferable method for discerning patterns regarding word frequency (allowing me to address sentiment and entity relationships). Jigsaw, on the other hand, allowed me to produce detailed WordTree visualizations that worked as a sort of additional approach in bolstering conclusions regarding outsider perception of Paterno (bigger picture as opposed to entity-level).


e.) Simply put, by engaging with both my corpus and the textual analysis platforms Jigsaw and Voyant, I have learned there are many opportunities for argumentation and subjective involvement in digital humanities research. In this way, I have learned to appreciate the role of technology in expanding the capabilities of nominal data analysis, but also understand that the implementation of digital methods into digital humanities does not generate essentialist interpretations (I now actually see where I could have gone in different interpretive directions). As Clement puts it, “Sometimes the view facilitated by digital tools generates the same data human beings (or humanists) could generate by hand…At other times, these vantage points are remarkably different from that which has been afforded within print culture and provide us with a new perspective on texts that continue to compel and surprise us by being so provocative and complex — so human” (Clement 12). What can be gleaned from this quotation, and my work on this assignment is that digital humanities does, in fact, involve a give and take between subjective and objective construction. By utilizing differential reading strategies and accepting the interaction of close and distant reading, researchers such as myself will be properly equipped to read and contextualize readily accessible and more distant digital findings (and acknowledge subjective intervention in text selection, platform construction, etc.).


Voyant StreamGraph Visualization


Voyant Bubblelines Visualization


Jigsaw WordTree Visualization


Jigsaw Document View Visualization
Categories
Assignment 2

Assignment 2

For the construction of my corpus, since I am doing a research related to twitter feeds, I’m familiar with tweet collecting procedure and I fully understand that there is much information that can be extracted from twitter feeds. Therefore, I determined that my corpus should focus on President Trump’s public twitter feeds. I downloaded his tweets through Twitter API and I have 50 files in total, each file containing 30 tweets. With this corpus, I can anticipate interesting findings like Trump’s main focus in the past months. Also, with my computing experience, I successfully scrapped off some useless and meaningless content from the original corpus such as urls.

Since these two platforms possess a number of functionalities, I chose some of the most important ones and made snapshots. Also, in order to compare these two platforms, I selected some similar and some different visualization tools.

Document in Jigsaw
Word Graph in Voyant

These two visualizations are created using two similar tools, which produce views of frequently used word in documents with different advantages and disadvantages. Obviously, the visualization produced by Voyant is much more beautiful, with the difference of frequencies shown more evidently. However, Jigsaw is superior to Voyant in the way that it shows these words with their contexts, which may provide more information to users.

Wordtree in Jigsaw
Link in Voyant

Since the wordtree functionality in Voyant only provides “America Great Again”, so I used link instead of word tree for Voyant. This functionality, like wordtree, provides information about words and their local relationship. The wordtree visualization in Jigsaw obviously shows the words’ local relationship in context, with different sizes representing different frequencies, which can offer direct knowledge to users. On the other hand, the link feature in Voyant produces better interactive visualization. Once selected the icons in the graph, users can either expand or remove icons, thus enjoying the benefit of iterative visualization. Also, the nice layout and colorful labels make the feature more user friendly.

Sentiment in Jigsaw

This feature is something unique in Jigsaw, not included in Voyant. This visualization shows the sentiment according to text analysis in different documents. Each block represents a file and darker color indicates greater sentiment value, in other words sadness or anger. This grid view tool can also do other analysis depending on different needs. It can produce special insight because it takes two variables into account. For example, it can produce a timeline showing the sentiment by choosing document date and sentiment for “sort by” and “color by” relatively.

Bubbleline in Voyant

This feature is only provided by Voyant, indicating the frequencies of different words in different documents. It can provide direct impression and is convenient for users to compare different files. The lines indicate the text order and different sizes represent the frequencies. Additionally, different colors indicate different entities. Therefore, this visualization includes at least three different dimensions, which provides a thorough and broad view of the data set.


During the process of corpus construction and visualization analysis, I found Tanya Clement’s observation is verified. The first part of her argument is easy to understand. Using visualization platforms, I successfully combined different kinds of information and created some multidimensional viewpoints. For the second part of her argument, I understand that due to the unknown algorithms behind these visualization platforms, the results presented may be biased. Therefore, I should keep in mind that the results may not be exactly correct when I do research using these visualization platforms.

Categories
Assignment 2

Assignment 2 – Steve Rizio

For our data visualization project, Katie and I analyzed religious texts to unveil the potential similarities and differences between them. Thus, our corpus is constructed of the Christian Bible, Muslim Quran, and the Hindu Vedas. The digital text of the Bible was available for us with the installation of Jigsaw. For the Quran, our professor had a digital text version of it on hand and shared it with us for our research. The Hindu Vedas is the only missing piece of text we do not have in our corpus at this time. I do not believe this will be problematic because simply Googling “Hindu Vedas,” we are met with multiple search results for PDF versions. I only have to download and look through a few samples to make sure they can be processed and do not have too many errors.

(For clarity, I will be using Voyant for the Quran and Jigsaw for the Bible in the image examples below)

Here is an example of using the Scatterplot tool in Jigsaw. The two axes show words that connect with each other. I noticed that this view presents a few repeat words connecting with each other, which adds little value to our research (example: “Jesus” connects with “Jesus”). The concept of the Scatterplot tool however does seem promising.

This is the Circular Graph tool. I liked the interactiveness of this tool. When clicking on one of the entities, connections to other entities are automatically displayed (on the outer rim of the circle). This provides an easy way for researchers to visualize the connectivity between an entity and other entity groups. The same “repeat words” problem that we saw with Scatterplot appeared with this tool also. I think both of these tools would be especially helpful if the user makes their own custom entities. I noticed though while using these tools that Jigsaw did not have discreet grouping, which resulted in self-connectivity. This made it a bit harder to identify real connections.

Voyant’s Word Cloud tool produced these results. The Word Cloud tool offers researchers a fast approach to understanding key messages in a text, simply because it shows by size the words most used. It does not require intensive effort to understand the results – with just a glance, users quickly see the major points by observing the largest words. Looking at the cloud, it is not surprising that two words that refer to Allah are especially prevalent (“Lord” and “God”). However, I did find it surprising that an important biblical figure, Moses, appears many times in the religious text as well.

The Trends tool helped me identify something peculiar. “Shall” was used extensively more than any other word in the beginning, but it eventually died down to “normal” frequency. I think this highlights the usefulness of this tool. If I was close reading the Quran, I likely would not have noticed the changing frequency of “shall” in the text, but the Trends tool visualizes this deterioration quite nicely. For users whose research depends on examining word trends, this tool will prove indispensable.

I think Jigsaw and Voyant are exceptionally useful tools for data visualization. Personally, I like the concepts in Jigsaw better than Voyant, because they seem more rich and intuitive to me, but the “self connection” error is a major drawback. Although Voyant shows easier to understand data visualizations, it does not offer as much information as the tools embedded in Jigsaw. Most of Voyant’s results can be summed up as a word frequency visualization. Jigsaw shows connections between words in more ways than Voyant can, which may help researchers iterate and extend their investigation.

My process of corpus construction and data visualization through Voyant and Jigsaw verify Tanya Clement’s observation. This is because I can appreciate how the different ways I approach my queries can shape the result of any data visualization. Data visualization is indeed a varied and complex process, offering up a rich set of observations any researcher can jump on as results are presented. This is an interesting contrast to the research process anchored in surface reading a piece of text, which seems far more non-iterative in comparison.


Categories
Assignment 2

Assignment 2

For the construction of Steve and I’s corpus, we have decided to take a look at three different religious texts. The Christian Bible, Muslim Quran, and the Hindu Vedas. Looking at these three different texts could show us a simple way of understanding what each book is trying to convey. We also wanted to make different visualizations to represent common ideas and differences between each text. We understand that there could be different interpretations to each book and what they try to convey, so we are going to use textual analysis to take the narrative out of the story and essentially getting the words themselves to convey the message. But using an interactive way of data visualization will allow us to better interpret similarities and differences between the three texts.

For the two images depicted, I took the first two chapters from the Quran and ran them through Voyant. Then I took the Bible and ran it through Jigsaw. These were my results.

In Voyant, I looked at the first two chapters of the Quran. Looking in the Cirrus, I can already see that “Allah’ is the most frequent word used (253 times). It makes sense for Allah to be seen most often in the Quran. Another interesting aspect to look at is the scatter plot of the most common word usage. Allah continues to rise in how often it is used, followed by “people”, “said”, and “lord”.

In Jigsaw, it was a little tricky to get to work, but I took a look at the Bible’s first and second testament. The issues that I seem to come across often are quite simply that the program does not exactly work. Whether it is because of my computer being a PC or perhaps the documents I am running through it, the same issue keeps appearing. This issue being selecting certain visualizing tools and having nothing load through. But through seeing the platform work on other’s laptops, I am able to justify that Jigsaw is much more usable when looking at word trends and its “word tree” option. I managed to get the wordtree option to work, which was interesting to look at words that are commonly used in succession of another.

Due to previous experiences with both platforms, I have formed a preference with Voyant. Jigsaw is difficult to use when documents exceed a few thousand words, making it almost impossible to use in certain circumstances without having to breakdown and chunk your texts. Voyant allows for simple input and simple output. What I mean is that the platform is easy to input your data to be analyzed with simple options. Once Voyant runs through your documents, it gives you plenty of options to visualize your data in interactive ways. At one point, Voyant even showed us that pronoun usage in some novels was much more of a prevalent concept to follow than what we were initially investigating. It turned out that male and female authors were more likely to use male characters than female characters. That was for a previous corpus we formed using science fiction novels.  Jigsaw can interpret data in ways that are much more thorough, though. When using something like Wordtree, Jigsaw is excellent at looking at different word trends.

When looking at the results of texts run through data visualization tools, you are viewing them in their most realistic and authentic state. The narrative is removed from the document, leaving it as a simplified collection of words. What this does is completely remove any sense of bias that could be present in the work. Tanya Clement’s claim that the use of  visualization platforms “… is a virtual reality that keeps us mindful of the processes we use to produce it, but the experience of this encompassing vantage point allows for a feeling of justice or authenticity that is based on plausible complexities, not simplified and immutable truths.”