In quoting Ben Schneiderman, Isabel Meirelles opens her chapter on network design structures by articulating the positive attributes of these types of visualizations, “‘Social network analysis complements methods that focus more narrowly on individuals, adding a critical dimension that captures the connective tissue of societies and other complex interdependencies’” (Meirelles 47). Throughout my experience learning Gephi by using the Native American baptismal database, I have found this program to be incredibly helpful in painting this picture of “interdependencies” and relationships that is difficult to see by looking at metadata alone. Unfortunately, gaining a true understanding of the relational characteristics Gephi is capable of visualizing takes a certain amount of discipline in avoiding the mutual exclusion of visualization and analysis. While Gephi does not necessarily “hide” anything in terms of calculations, as users are offered an intimate look into what is being done when statistics are calculated or force-directed layouts are implemented in visualization, this opportunity to truly understand how data is being translated is easily ignored by individuals caught up in the “click-aha!” trap that is so common with digital visualization platforms (for example, when using partition tool to color and size nodes or manipulate edges). In this way, my experience with Gephi harkened back to Elijah Meeks’ work: “…I spent my time teaching folks how to use Gephi, and I tried to spend some time telling them that the network they create is the result of an interpretive act. I don’t think they cared, I think they just wanted to know how to make node sizes change dynamically in tandem with partition filters” (Meeks 2). This experience of Meeks’, which I perceive as an all-too-common one for those working in Gephi, also opens the door to some of Johanna Drucker’s skepticism, “So the first act of creating data, especially out of humanistic documents, in which ambiguity, complexity, and contradiction abound, is an act of interpretative reduction, even violence. Then, remediating these ‘data’ into a graphical form imposes a second round of interpretative activity, another translation” (Drucker 249). Simply put, by tying my short time with Gephi to the writing of Meeks and Drucker, I was able to arrive at one of my most unavoidable critiques of Gephi: that the platform, hard as it may try to avoid this, allows users to ignore the fact that their data has humanistic, nuanced, and narrative elements behind it (although the Data Laboratory tab is helpful in keeping individuals from being too far removed from their database to begin with). Unless individuals take the time to slow down and understand what is going on when different statistics are calculated or relationships are generated, the true power of Gephi is rendered almost useless.
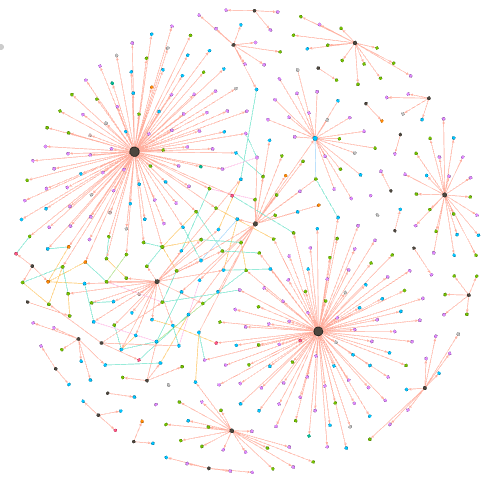
In terms of my visualization, I chose to generate a relational network consisting of Native Americans and baptizers (nodes). These nodes were connected by edges representing both baptismal and kinship relationships (for individuals labelled in the database with Unique ID’s 26-75). In total, my multimodal visualization, which utilizes a force-directed layout based on the Fruchterman-Reingold Algorithm, has 404 nodes and 438 edges (with most nodes representing Native Americans and most edges being classified as baptismal). Once I created these connections in Gephi, I elected to color both nodes and edges with nodes being colored according to an individual actor’s nation (or “baptizer”) and edges by the type of relationship represented (for example, baptismal, marital, parental, etc.). The statistics that I elected to run in order to analyze the baptismal database were Degree, Modularity, and Eigenvector Centrality.
Degree:
By using the “ranking” tool in Gephi to size nodes according to degree (not in-degree or out-degree due to some edges being undirected) I was able to glean several important conclusions from the network. I immediately noticed that the nodes representing baptizers were the most impacted by sizing according to degree (more so than Native Americans). Considering baptismal relationships make up a significant portion of the connective tissue of this relational network, running a calculation for degree shows how influential individual baptizers were in spreading Christianity (baptizers with high degrees, like Camerhof, Christian Rauch, and Marin Mack were more influential in the spread of Christianity than those with lower degrees, like Grube or Utley). The degree calculation, which shows the number of connections a node has, also introduced me to Johannes, a fascinating character in the story of the spread of Christianity. The node representing Johannes was noticeably larger than those of other Native Americans when size was dependent upon degree. This is because Johannes was not only a Native American and Christian convert, but also a baptizer himself. Therefore, he effectively helped to spread Christianity through baptismal relationships, not just kinship ties (which was a characteristic that distinguished him from the other Native Americans in the database).
Eigenvector Centrality:
Unfortunately, I did not find this statistic to be terribly enlightening while I worked in Gephi. I believe this is likely because a majority of the edges I have in my database are directed, baptismal connections. For this reason, the only members of the database that have a real opportunity of having a high Eigenvector Centrality are baptizers that are connected indirectly through the limited kinship ties I was able to generate (as these would connect well-connected baptizers to one another). In my visualization, this resulted in Martin Mack and Cammerhof (along with the Native Americans whom they baptized) to have the highest measures of Eigenvector Centrality, as their “baptismal worlds” were the only two that were brought into contact with one another through the edges representing kinship ties.
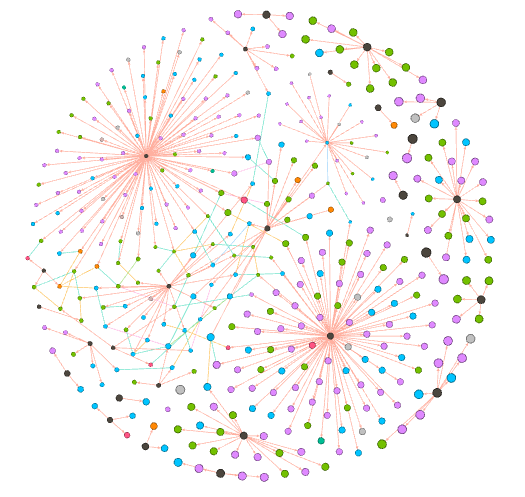
Modularity:
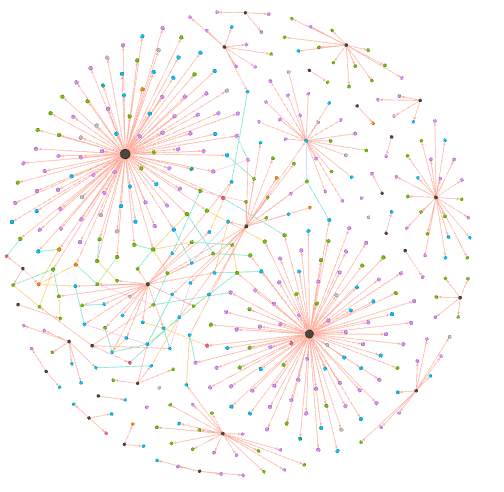
After sizing nodes according to modularity, I was faced with another interesting iteration of my network diagram. As can be seen above, the modularity calculation helped to present several “small worlds” hovering around the outside of my force-directed graph. Although I was initially confused by this image, I soon came to the conclusion that these small worlds likely would not exist had I manually entered edges representing kinship relationships for all Native Americans in the database (beyond just 26-75). In my visualization, some people may have artificially high modularity for this very reason (because baptismal connections are present but kinship are absent). Essentially, I believe I have created a visualization that contains satellite baptismal communities absent of the familial ties that could effectively deflate the modularity statistic.
Following from this, the fact that modularity is relatively low amongst certain baptizers connected to Native Americans with kinship ties present also helps to show the tendency of different baptizers to work with members of singular families (as well as cross national boundaries). This is due to the fact that multiple baptizers working with members of singular families (for example, spouses being baptized by different people) helped to generate a highly interconnected Christian network of Native Americans and baptizers and effectively eliminated the presence of “small worlds” in certain areas of the network (baptizers connect different families and limit isolation in the network).
Classifying edges proved to be extremely helpful in arriving at this inference, as it demonstrated that individual baptizers likely did not share intimate connections with specific Native American families. This is shown by the colored edges themselves, as kinship relationships visually represent connections between “small baptismal worlds.” (for example, spouses, brothers, sisters, parents, and children appear to be rarely welcomed into the Church by the same baptizer).