For this assignment, I used the Cushman Collection’s dataset. This dataset contains metadata of images taken by amateur photographer and Indiana University alumnus, Charles W. Cushman. Importing this data into Palladio and Google Fusion Tables reveals some interesting aspects.
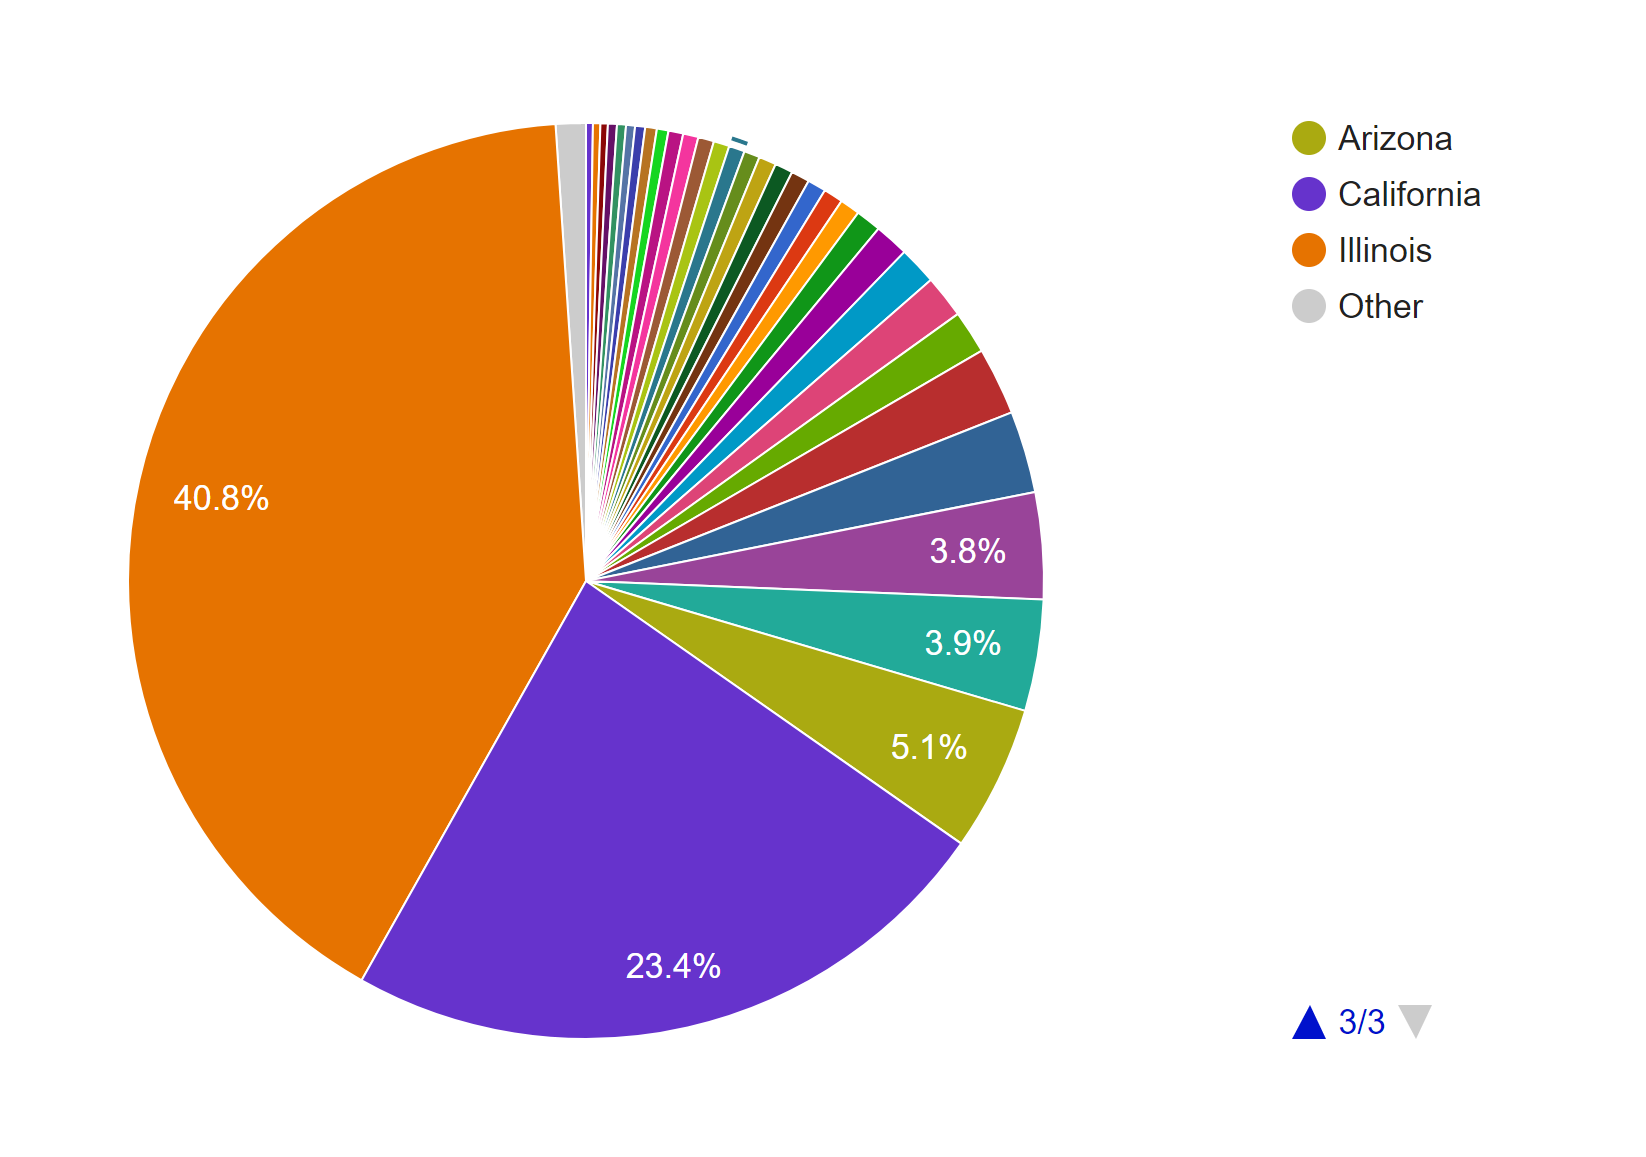
First, I tried mapping out the locations where the photos were taken. Looking at these identical maps from Palladio and Google Fusion Tables, we can infer that most of his photos were taken at Illinois and the West Coast.
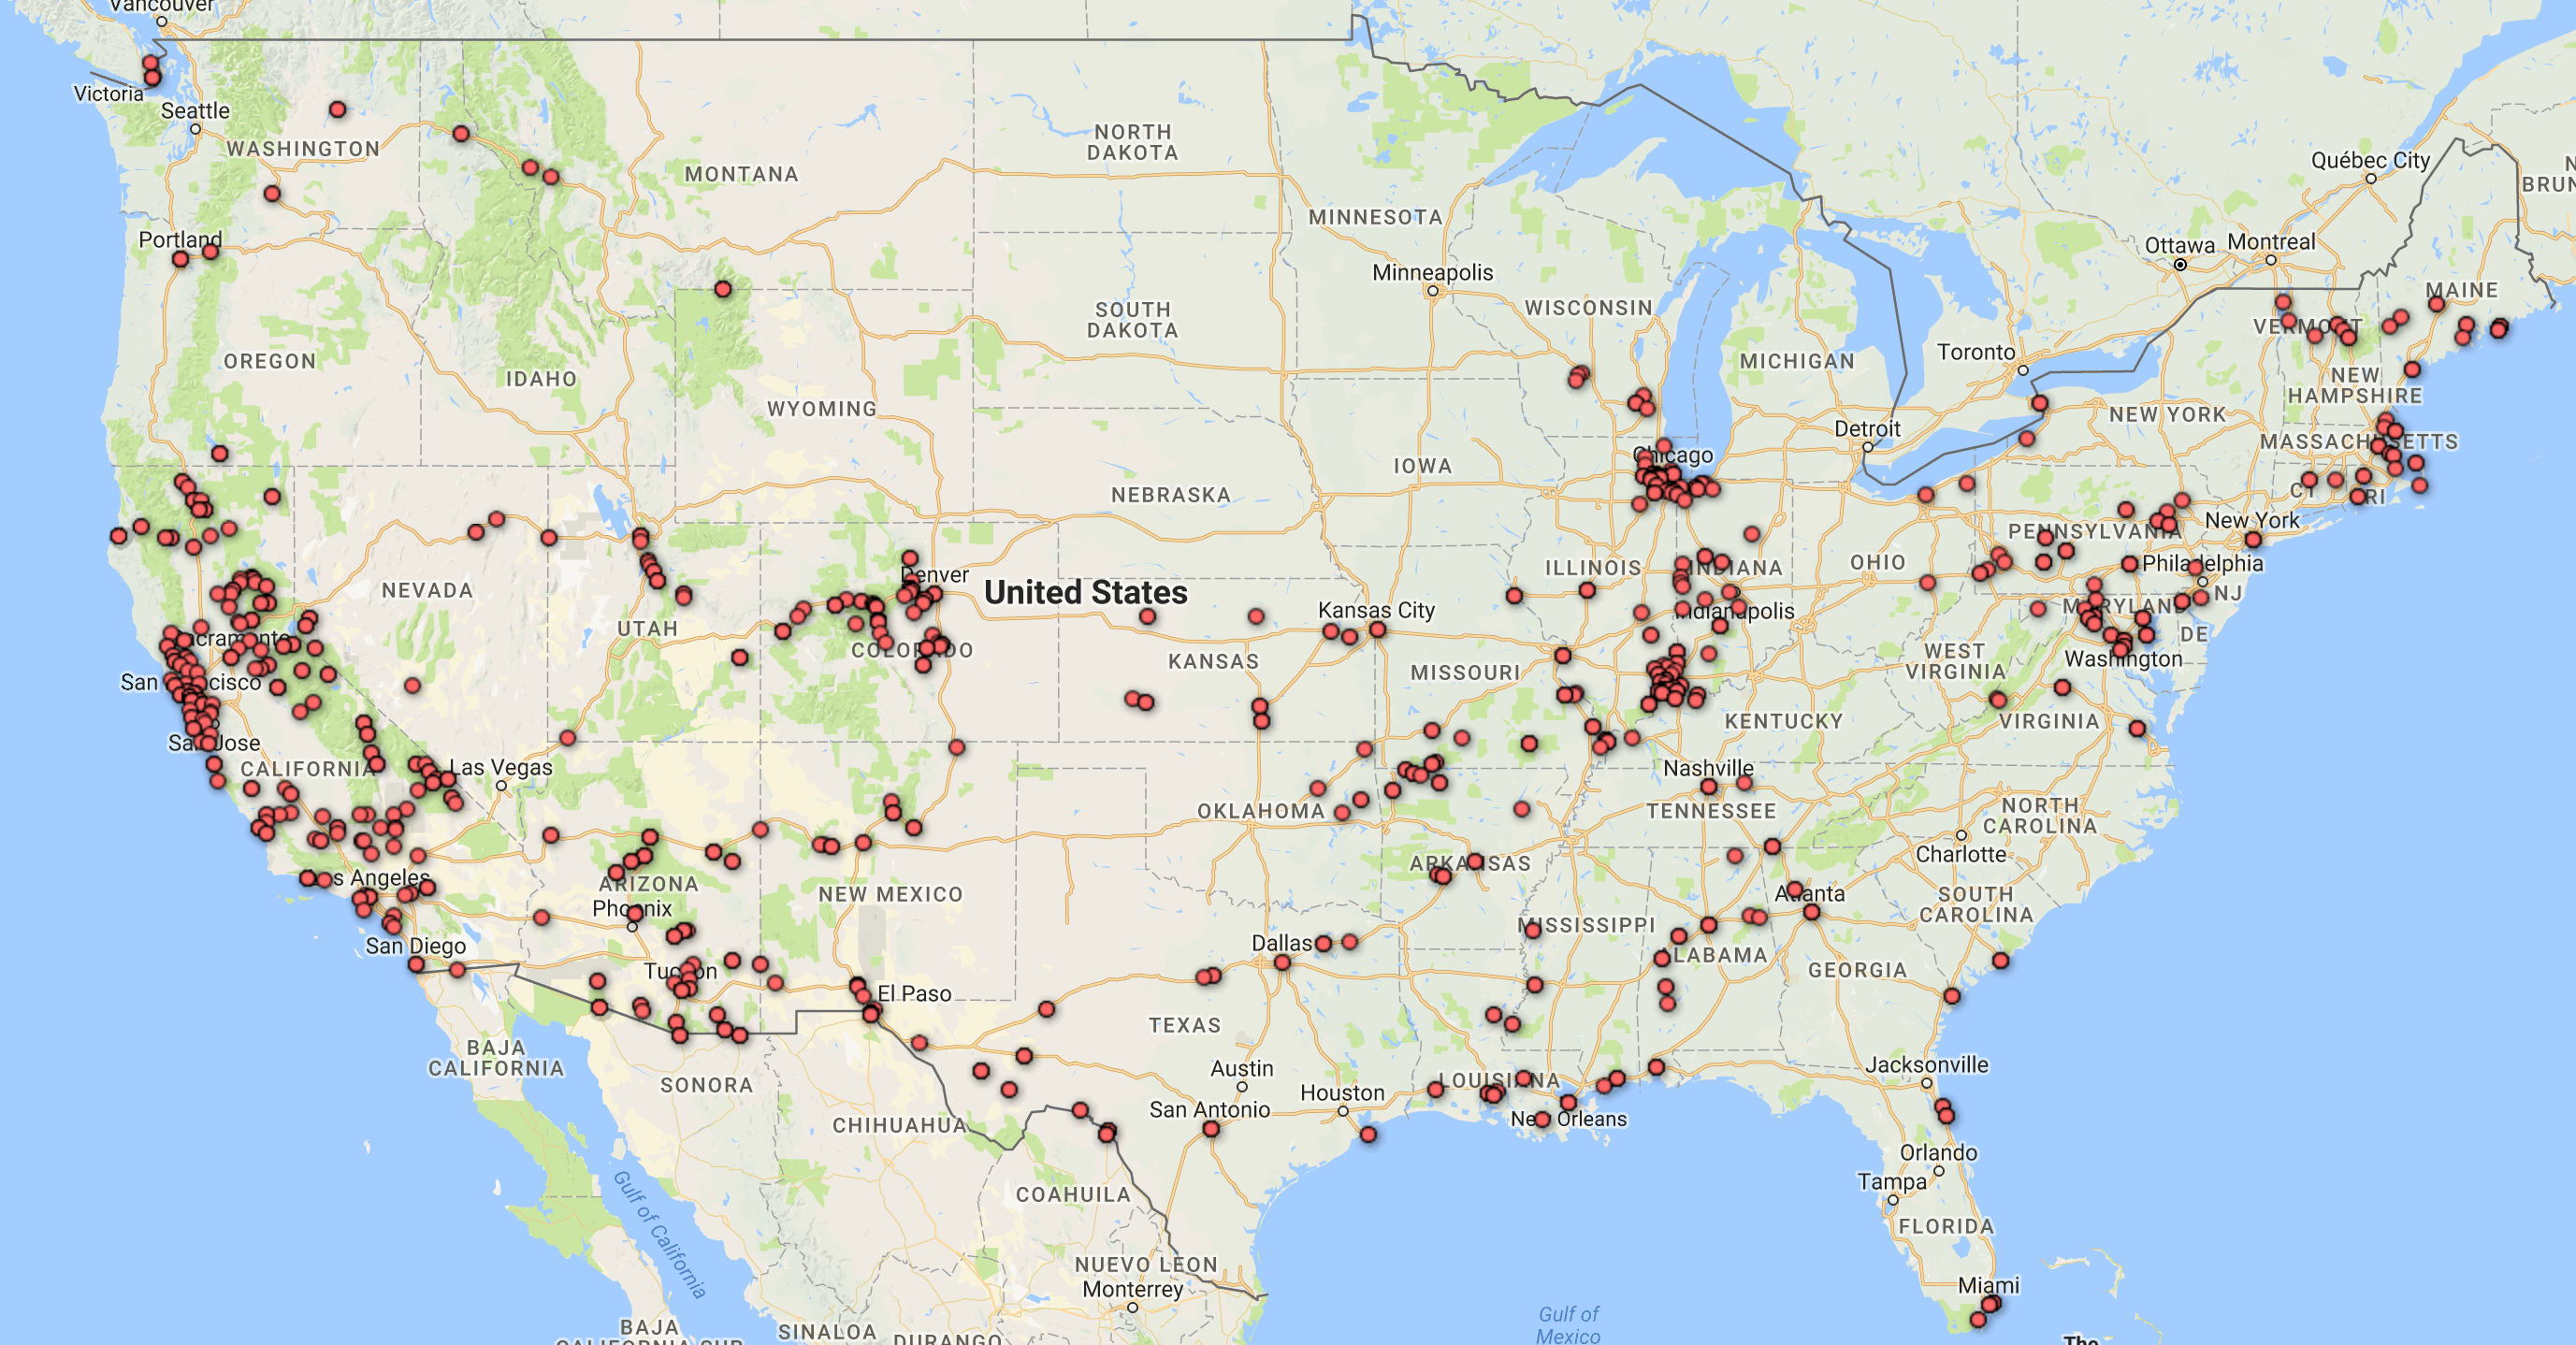
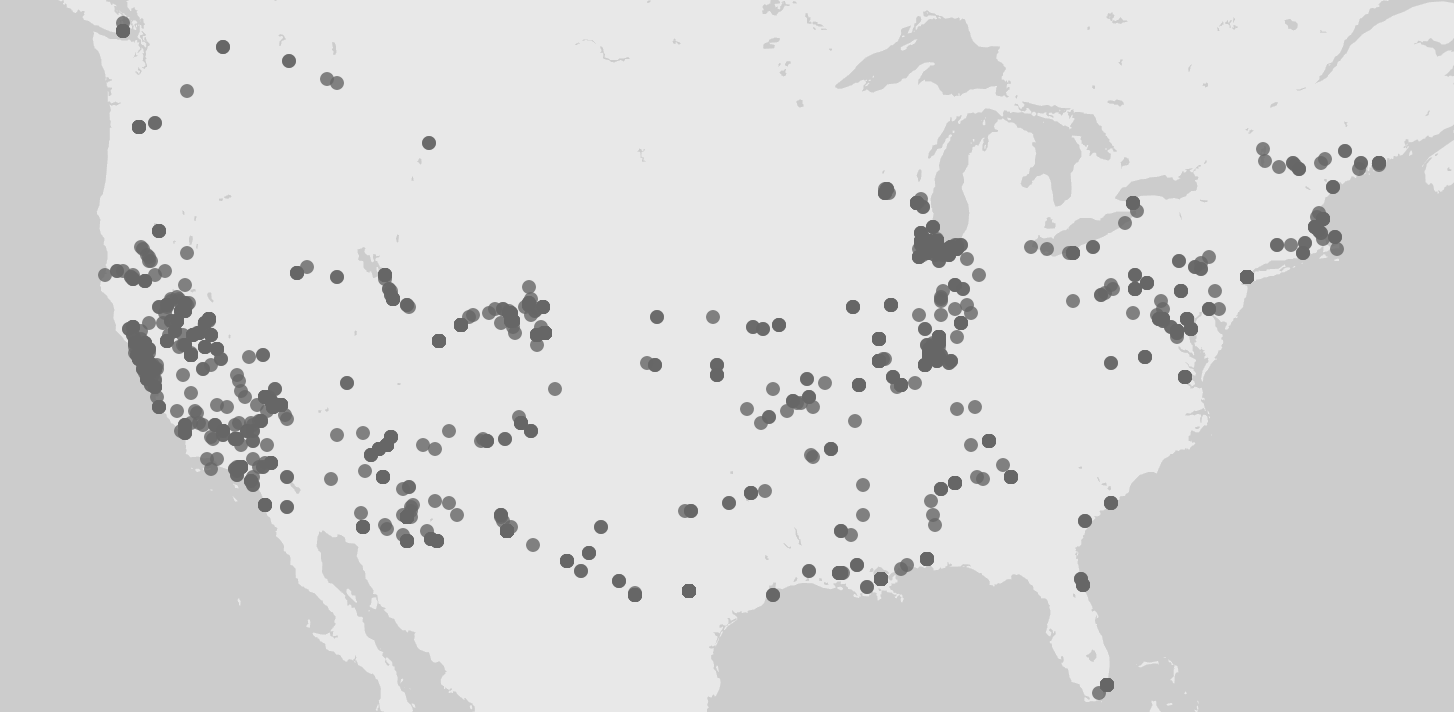
Adding a facet to the data in Palladio confirms our inference. Moreover, this facet also reveals that the photos from Illinois were mostly taken after 1940 and before 1952, while the photos from California were mostly taken after that period. A quick check at his biography provided by the Indiana University Archives reveals that he spent most of his life after college in Illinois and only moved to San Francisco in the 1950s. 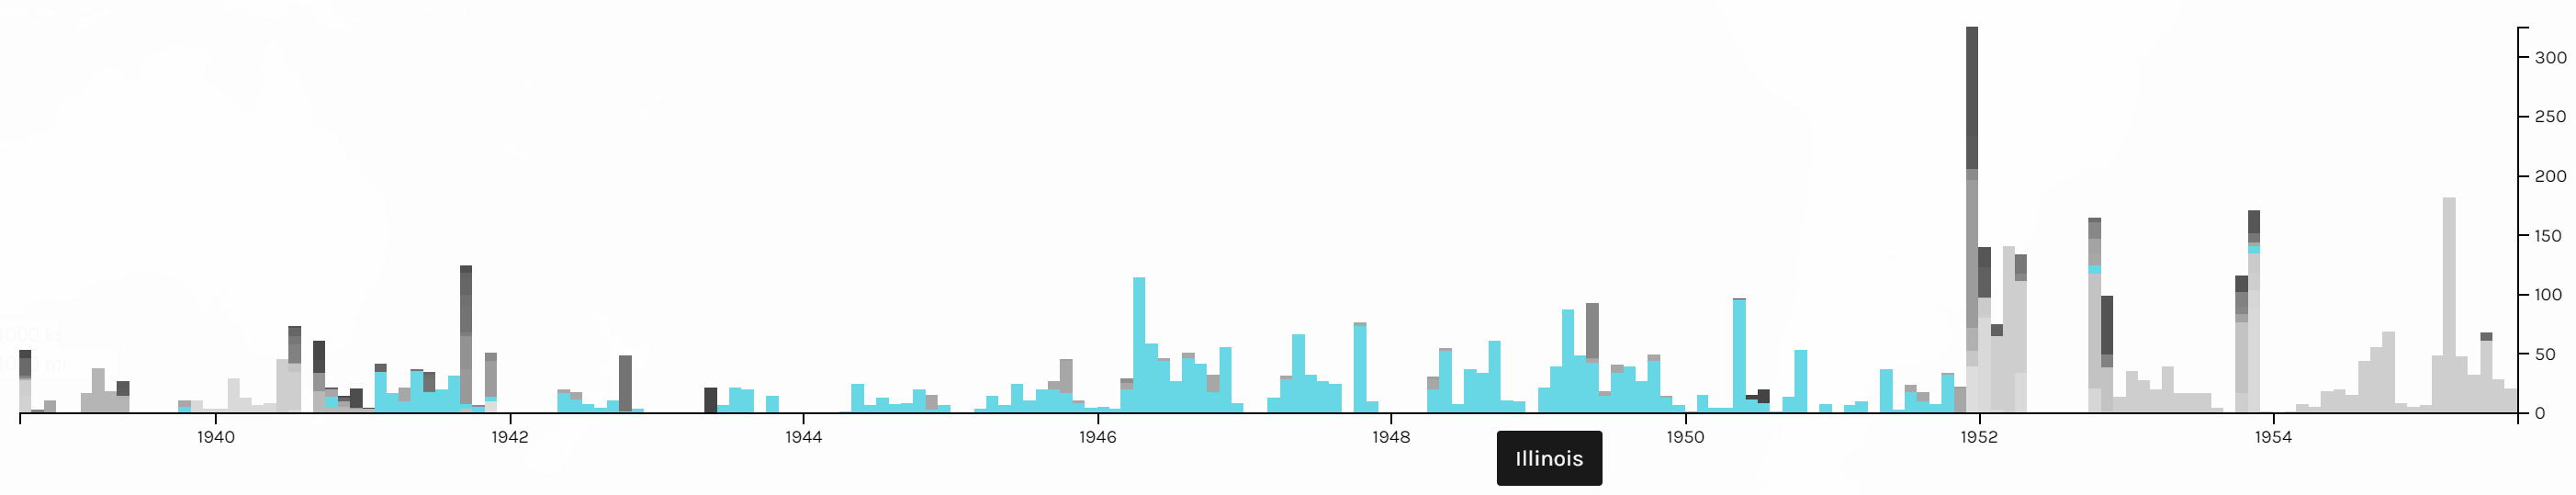
To further confirm this conjecture, I also made a pie chart in Google Fusion Tables.
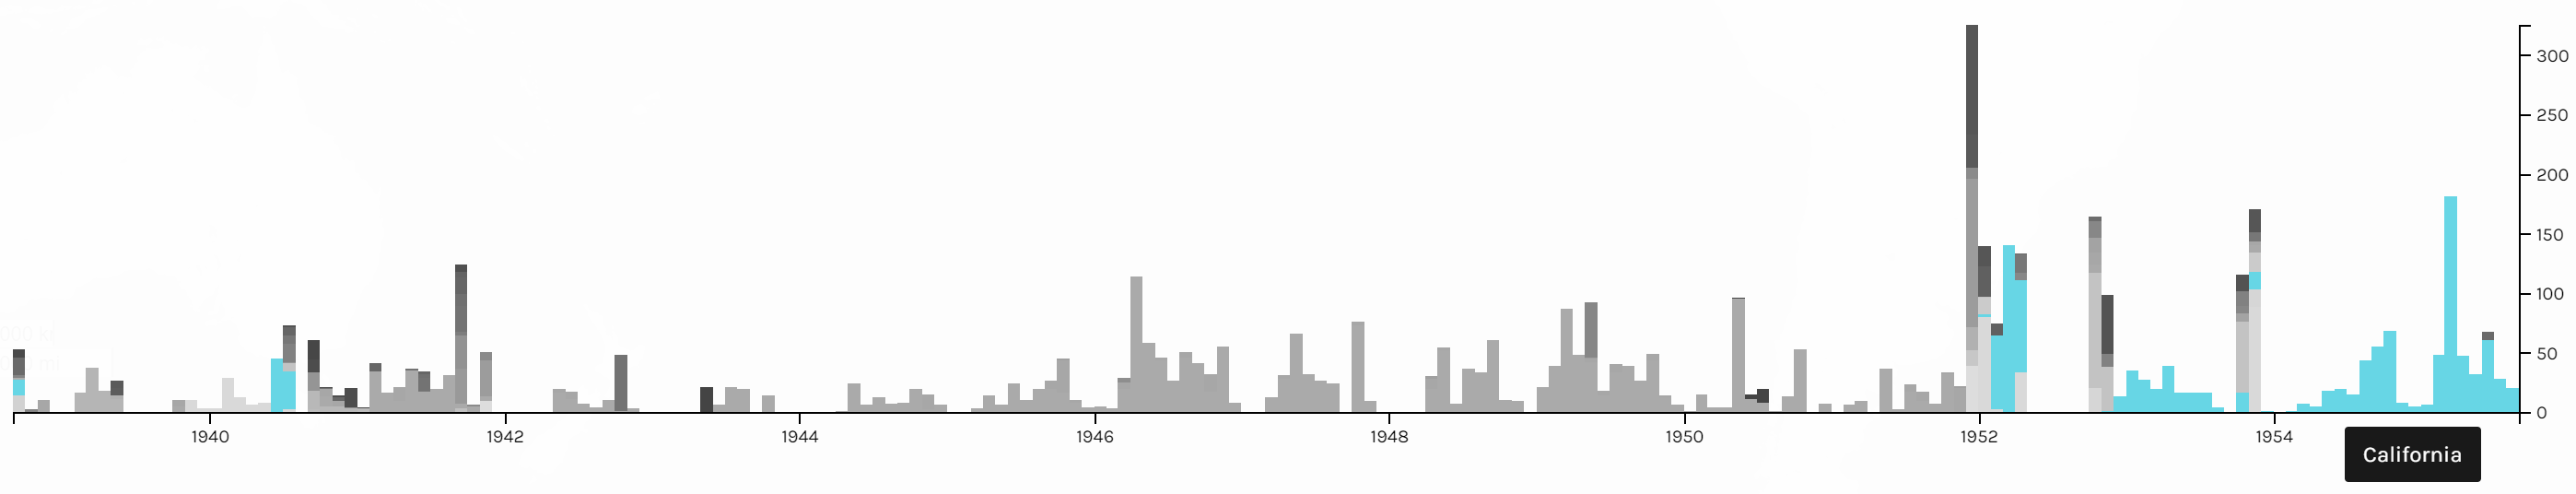
The timeline tool from Palladio also tells us that his photos were not archived until the 1940s. After that period, however, they were archived not too long after they were taken. Although Palladio did not allow me to scale the x-axes of the two timelines to match each other, the general patterns seem to support my assumption.
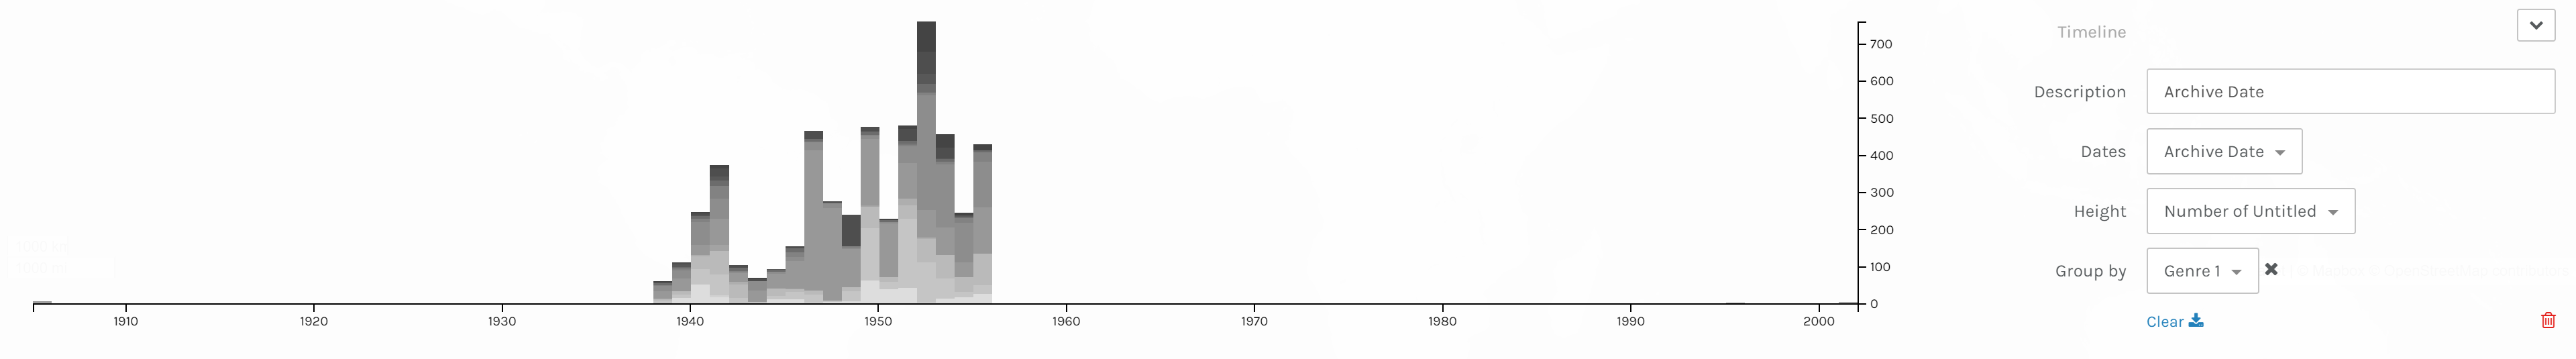
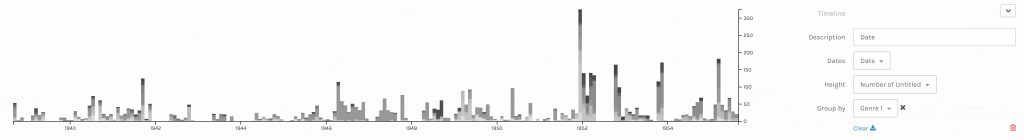 Timelines of photos by date taken (below) and date archived (above).
The next thing I explored in this dataset is the genre of the photos. This information is provided in two columns, Genre 1 and Genre 2, in the CSV file. Since the Genre 2 column is sparsely filled out, I only considered the data from the Genre 1 column in my visualizations.
This pie chart from Google Fusion Tables shows that Cushman’s collection consists mostly of identification, landscape, architectural, and cityscape photographs.
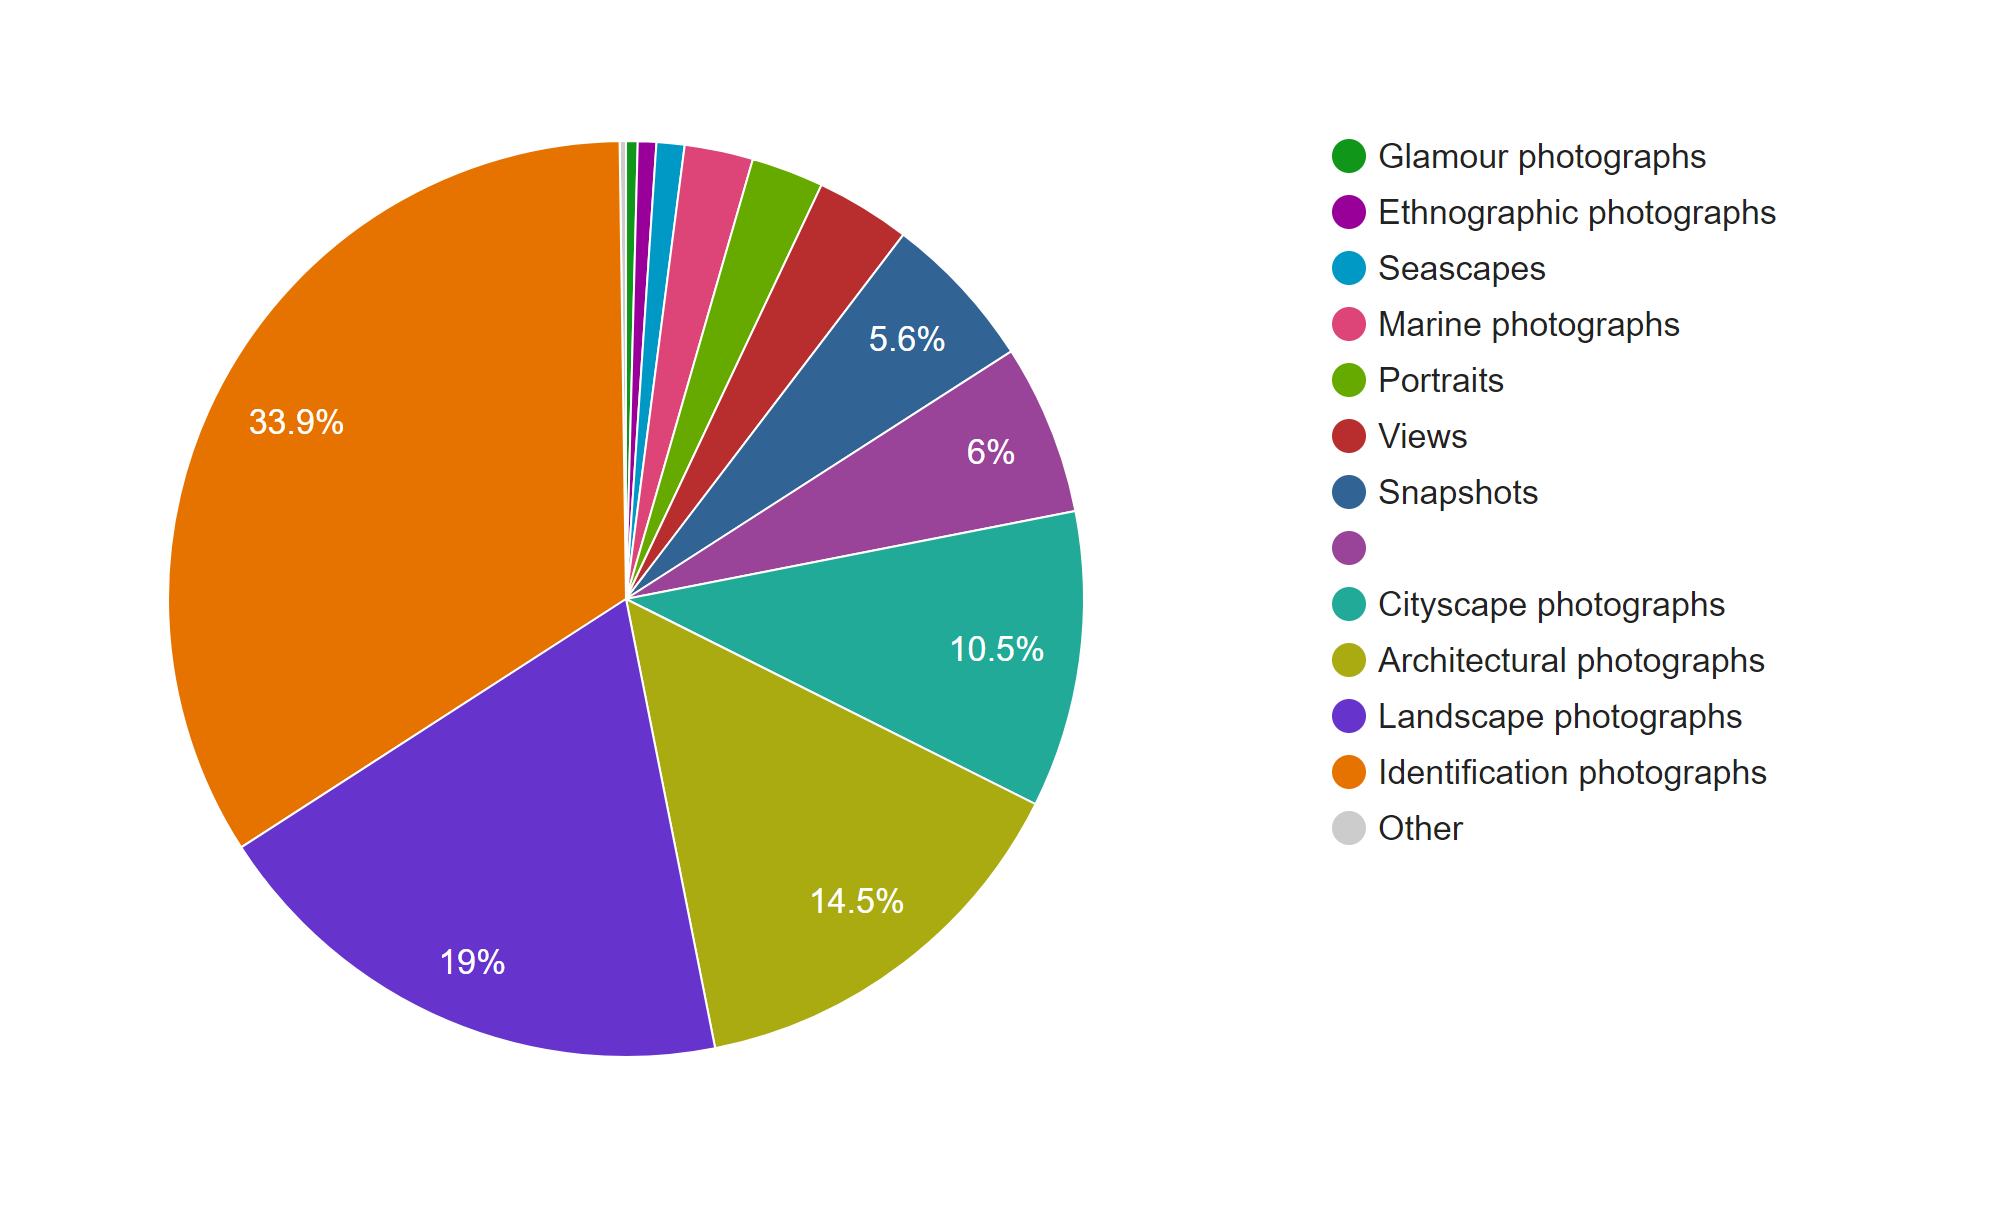
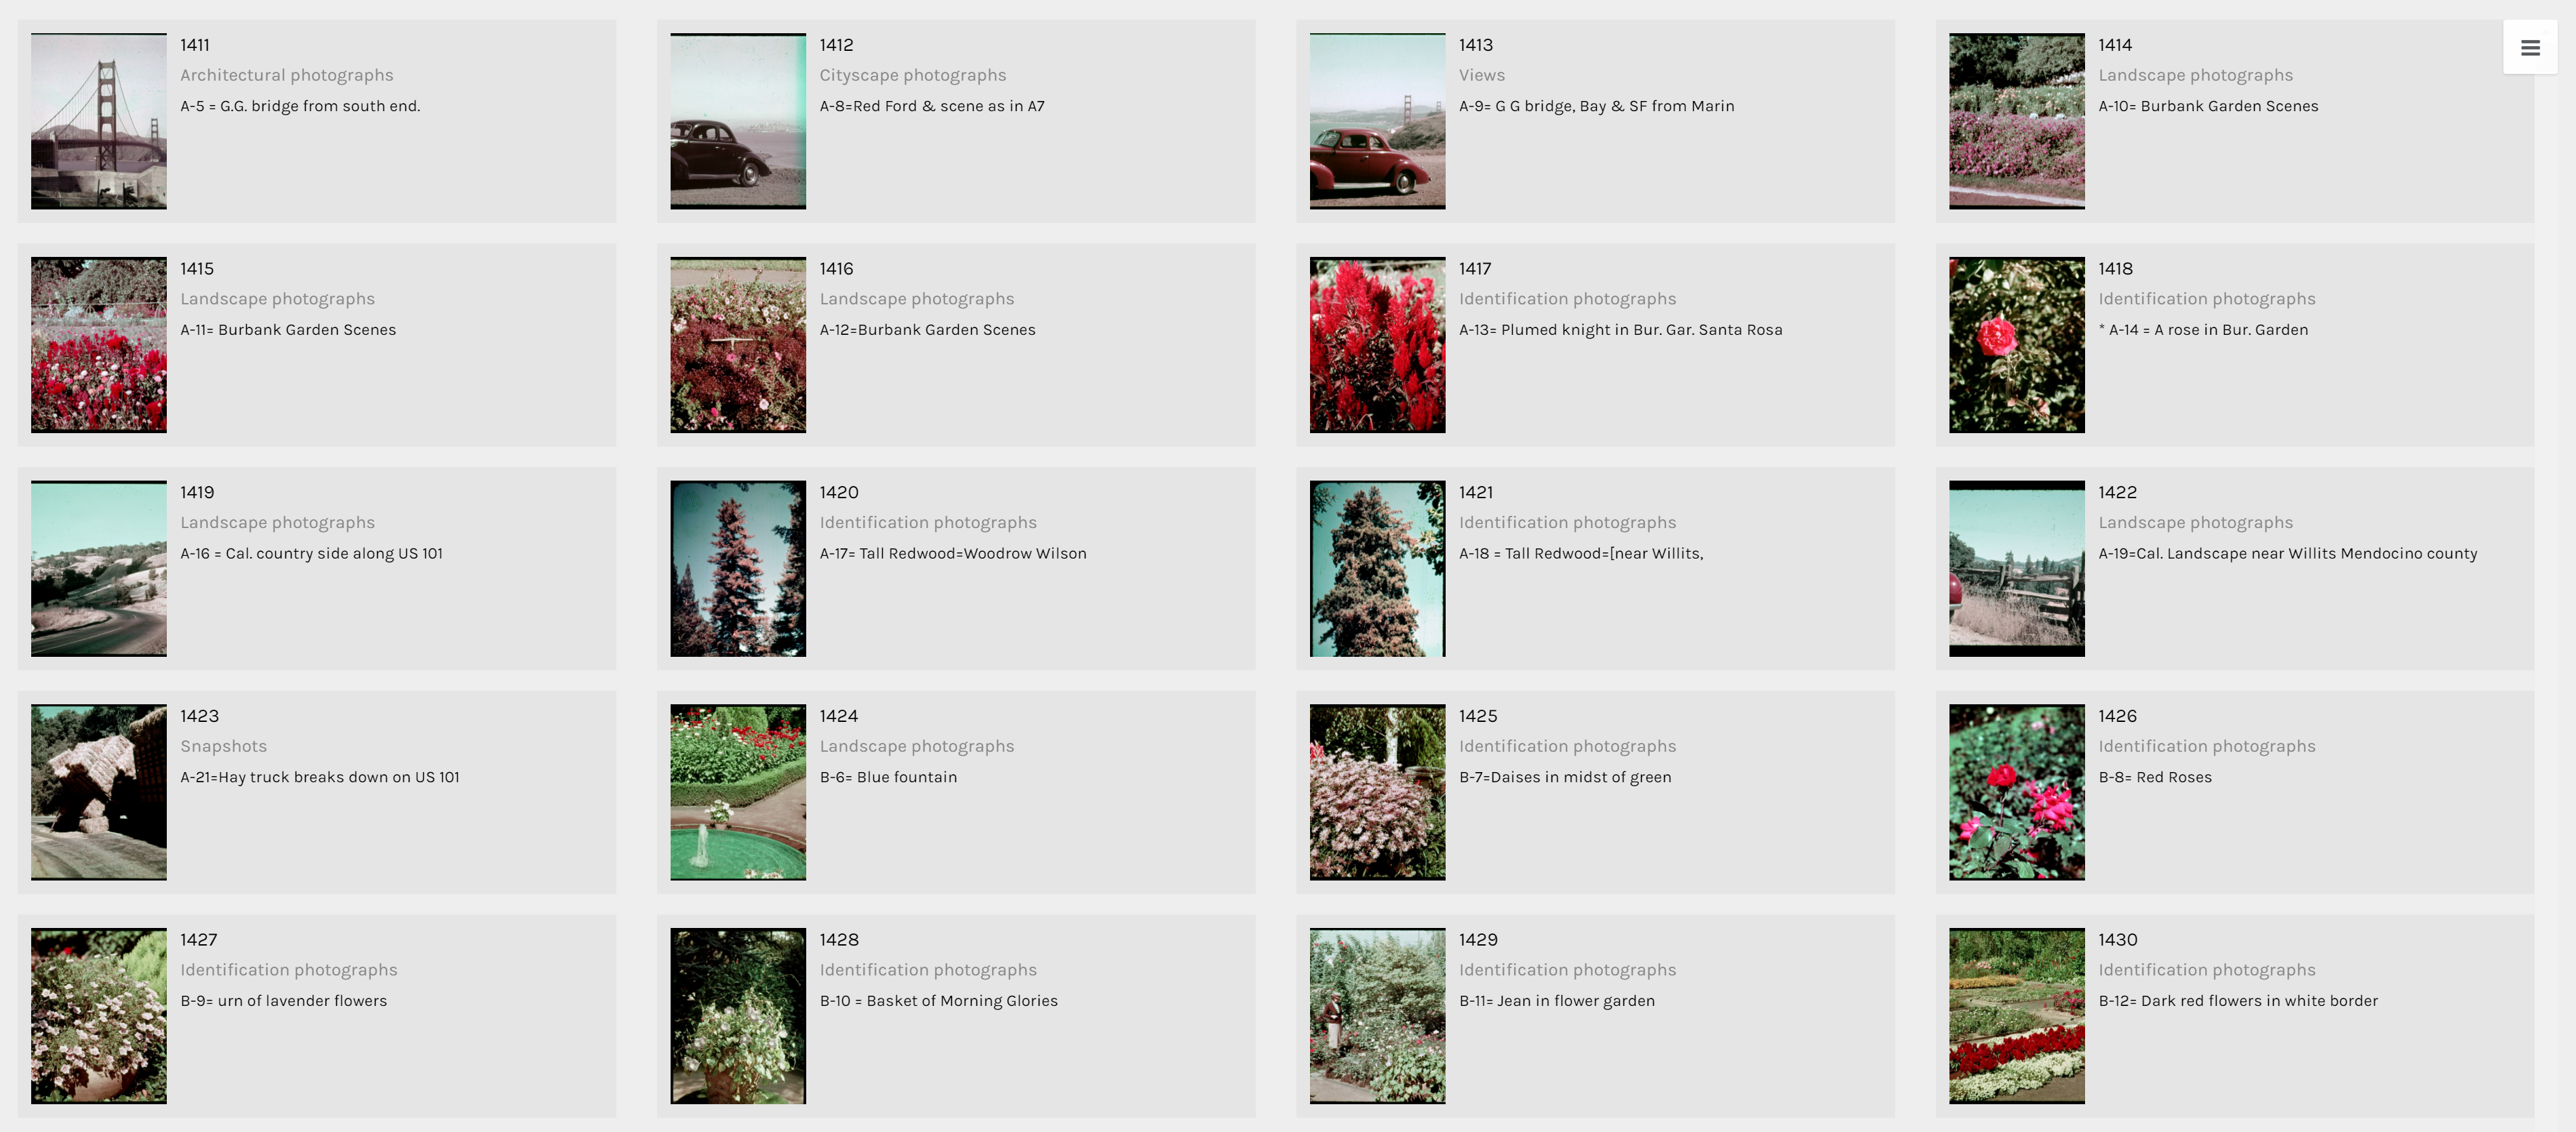
The term identification photograph as used in original dataset made me think that one third of this collection was portrait photographs that you can find on driver’s licenses and passports. However, switching to the Gallery view in Palladio, I realized they are actually identification photographs of species of plants.
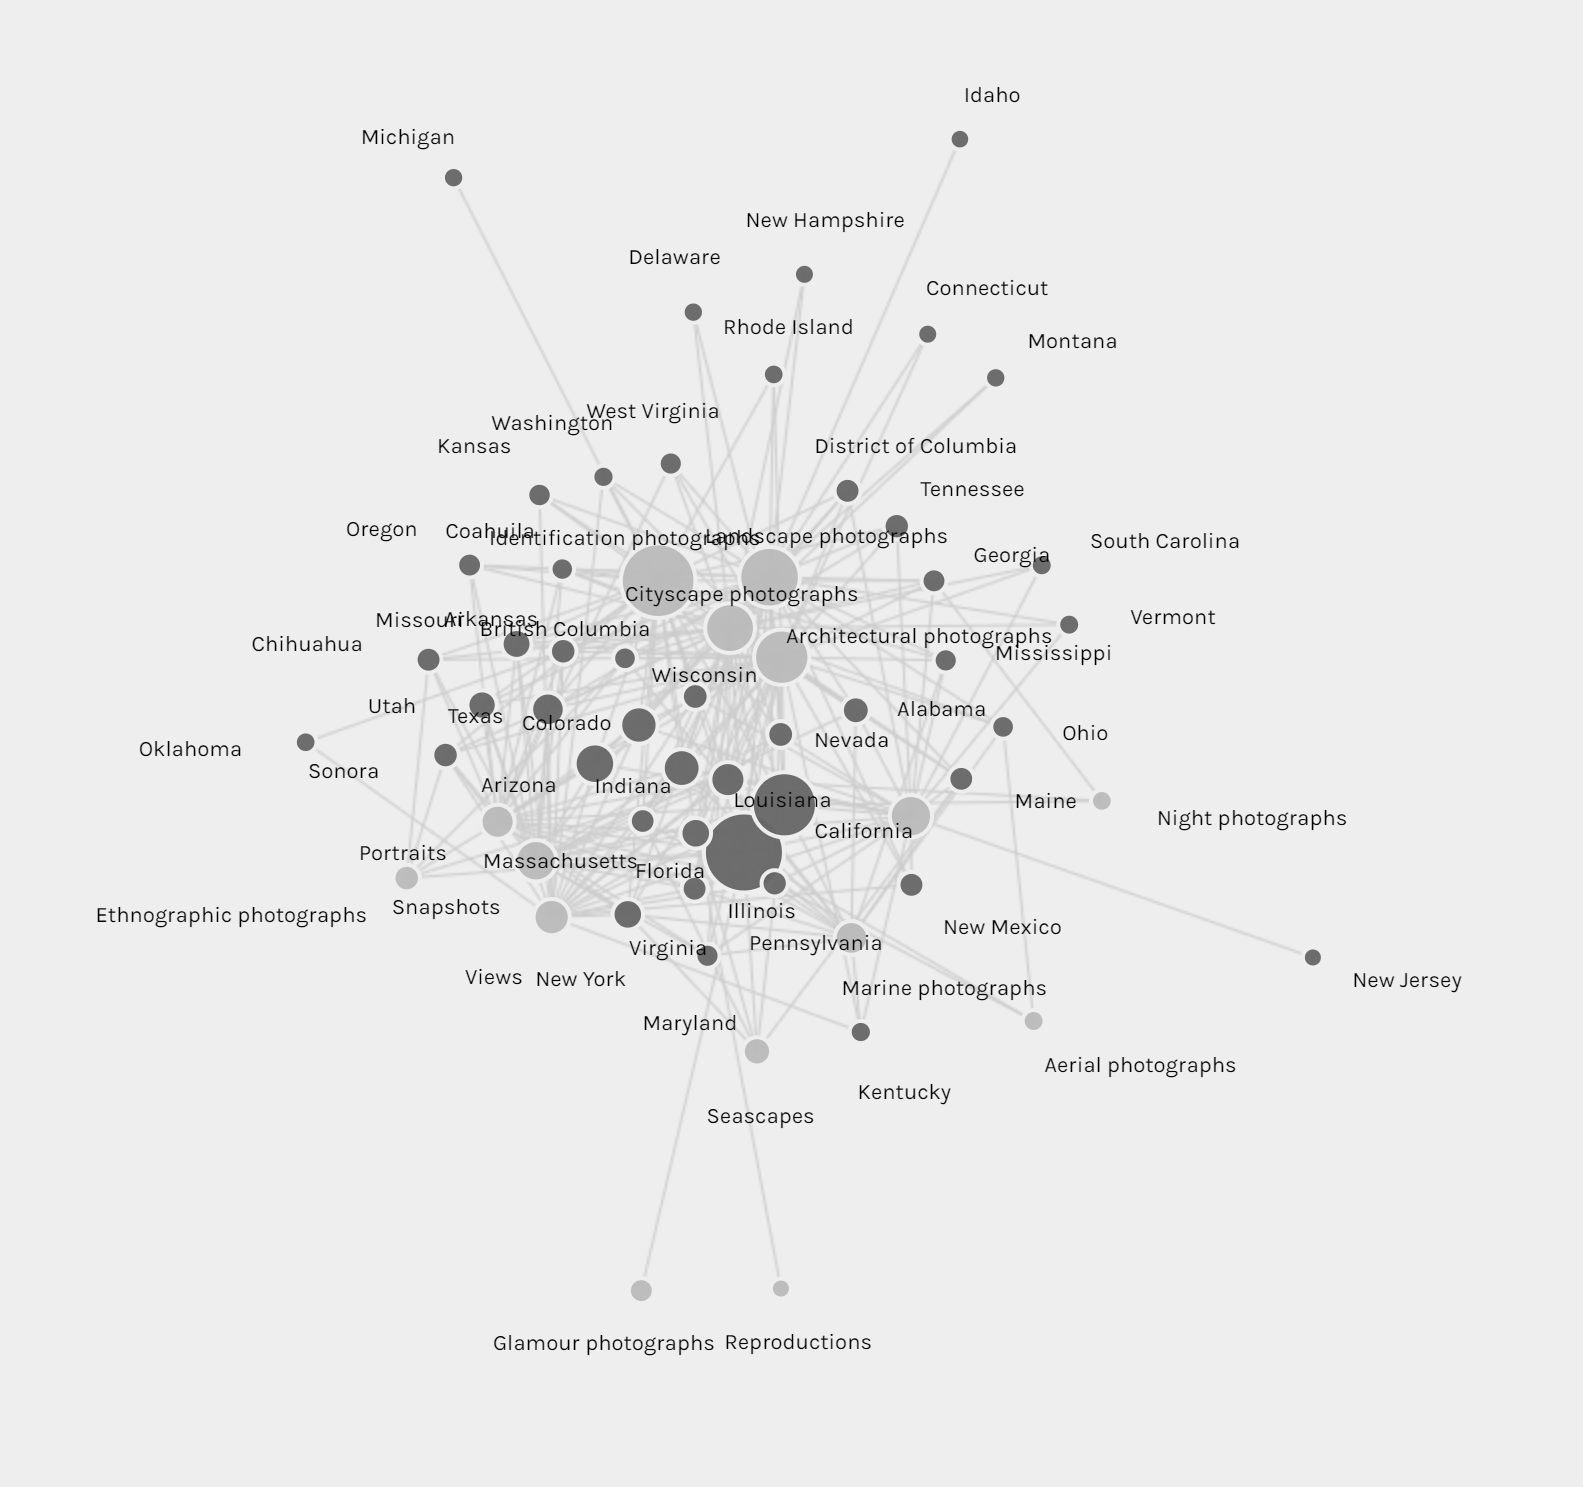
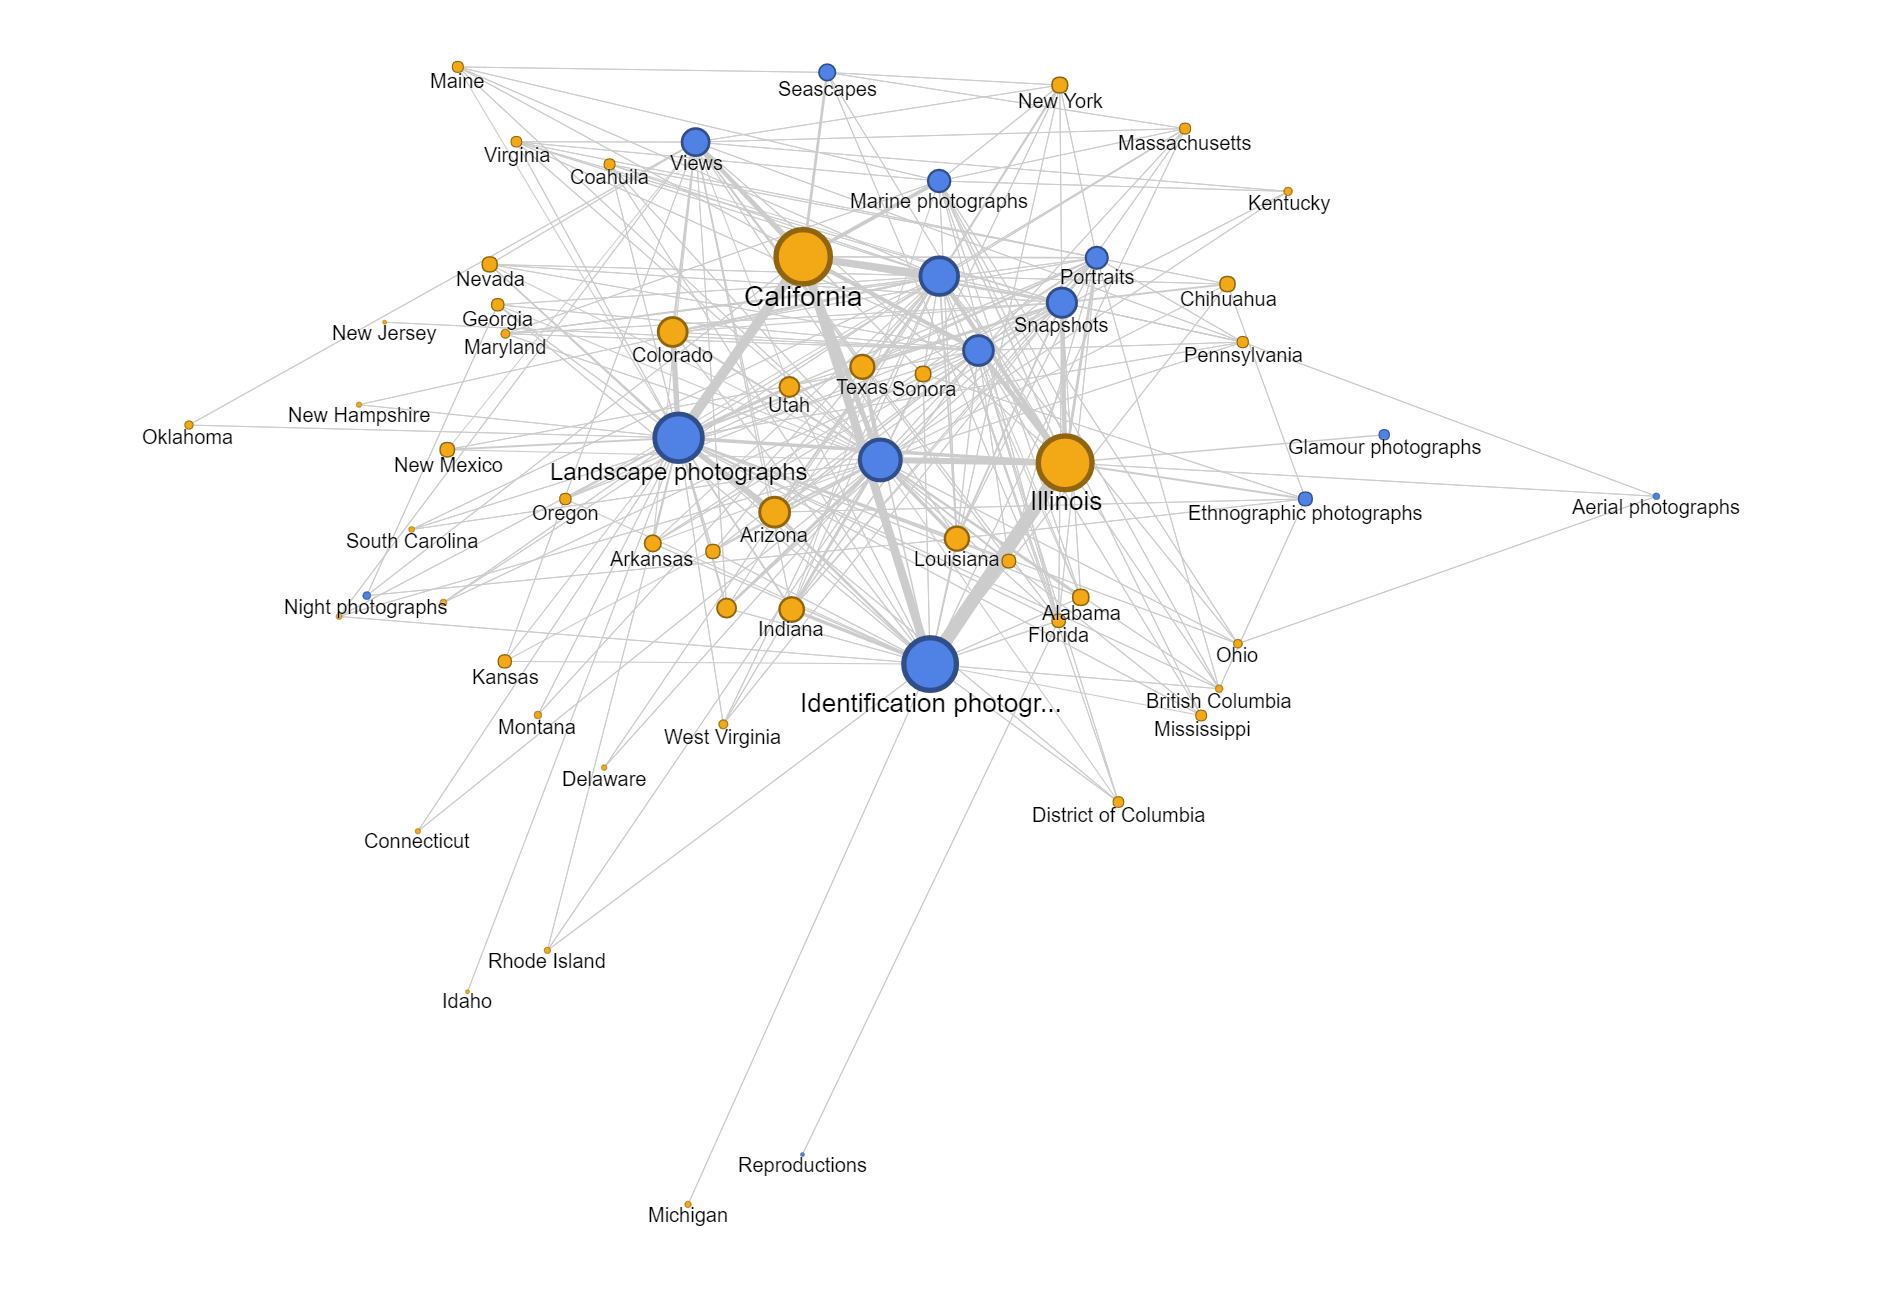
Another aspect of this dataset that I wanted to look into was whether the genre of photographs changed based on the state Cushman was staying. However, neither of the tools provides the option for stacked bar charts based on location. Thus, I tried creating network graphs with the state and the genre as my parameters. Although the resulting visualizations are quite nice to look at, they do not provide any helpful information and only vaguely reconfirms the assumptions provided by the previous visualizations that I made.
Since datasets, particularly this one, are usually multi-dimensional, I think that these kinds of visualizations can only present a certain aspect of the data at a time. In other words, they are partial representations rather than the whole image of the data itself. As Drucker mentioned, since these methods of visualizing information come from the natural sciences, they impose certain biases on the visualizations themselves. For example, we know from the dataset that Cushman took a lot of identification photographs. However, by counting the number of photos in each genre, we also strip these photos of it aesthetic and sentimental values. For instance, we do not know which photos were the defining moments in his photographic style or which were the ones that meant the most to him emotionally. Or just simply by categorizing the photos as identification photographs without providing the thumbnail images can give the viewers a wrong impression of the kind of photographer he was.
Nevertheless, it does not mean that these kinds of visualization do not generate new knowledge. Nowadays, data is being generated at an unprecedented rate. Since human’s computational capacity is limited and this data is mostly digital-born, computer-generated visualizations provide an efficient way of discovering things about humanities. For example, the maps that I created infer that Cushman lived and worked in Illinois and California for most of his life, which was mentioned by the Indiana University Archives. On the other hand, by arranging his work on a timeline, we can also the period where he moved to those states.