

I choose this visualization because it does a fantastic job in dynamic interaction and it looks fancy. “Interactive visualizations, on the other hand, aim to explore available information, often as part of a process that is both sequential and iterative.”(Sinclair, paragraph 2) It is obvious that this visualization provides multiple ways of interaction that can not be fulfilled by static visualization, allowing users to access different information from various perspectives both sequentially and iteratively. Moreover, this visualization uses creative and emergent methods to illustrate the relationship and information in the network. Choosing a center, users can see a relationship network centered with the chosen artist. Clicking on the artist labels, users can further select different options, such as “expand”, “remove” and “create map”. “Expand” and “remove” can increase or reduce the complexity of the network. “Create map” can create a new network centered with the chosen artist. There are different words in the background, which are different attributes that belong to some of the artists in the network. Hovering on these attributes, the artists that have these attributes will be shown, thus providing users with direct and obvious information. Similarly, hovering on artists will lighten the artists’ attributes. To conclude, this visualization provides not only information from different perspectives but also strong interaction.
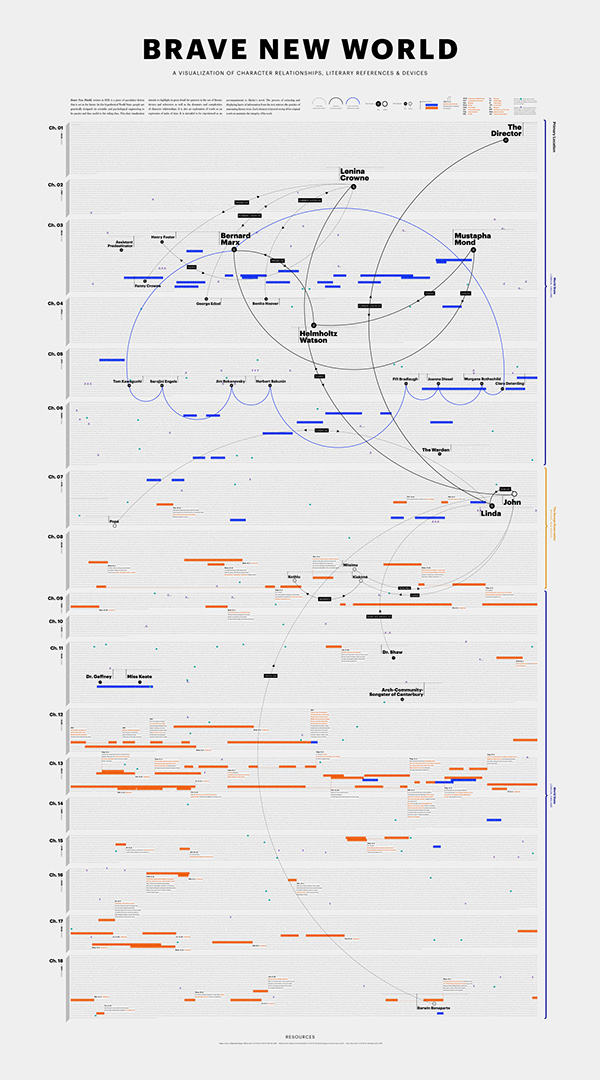
In order to show some differences between dynamic and static visualizations, I choose this static semantic network visualization as the second one. Although the resolution of the picture is low, it’s easy to see that this visualization uses different dimensions to illustrate information, such as colors of lines, solid or hollow dots and colors of bars. Also, since the visualization is based on a book called “Brave New World”, on the left there is a dimension of different chapters. “For chronological data, the timeline is a venerable visual format, whether manifested statically or interactively.”(Sinclair, paragraph 2) This timeline like feature make this visualization more organized. It is really different from dynamic visualization that static visualization is hard to interact with users. However, clearness and easiness can also make a static visualization helpful and informative.

For the visualizations in DH Sample Book, I love this visualization most due to it’s easy but nice looking. It is a dynamic visualization that provides various perspectives and fantastic interaction. At first glance, the complex lines may seem to be misleading. However, when hovering on different people, clear relationship will be shown. Furthermore, after clicking them, more text information can be viewed. “That is, some steps come before others, but the researcher may revisit previous steps at a later stage and make different choices, informed by the outcomes produced in the interim.”(Sinclair, paragraph 2) It is evident that users can revisit former steps and make different choices in order to make comparisons and access more information. These interactive, organized and creative ways of understanding the material are really attracting.