I chose to analyze the original Sherlock Holmes short stories by Conan Doyle. The idea came from our analysis of the London map in class the week before this assignment. I’ve omitted the novels in an attempt to keep the corpus even throughout. I feel the short stories were an excellent choice of corpus for this assignment, namely for Jigsaw. Doyle released the adventures in collections, making them fit for classification throughout the years, furthermore they each have roughly ten entries which is perfect for Jigsaw. In this way it was very easy to decide which texts I should use, as they could all be used fairly easily. Additionally the short stories are close to 10 pages, which makes Jigsaw far more useful. All of these factors helped in choosing Sherlock Holmes for a corpus. I’ve chosen to analyze Doyle’s writing style as the stories got older, and if he tried to tailor his style to meet demand as time went on.
Collecting the corpus was fairly simple. Being such an old series of works, they were all available free online. I found plain text versions of each work and copied them all into their respective categories. From there I went to Jigsaw.
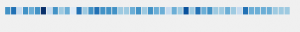
My first visualization is of the words relating to the works over time. As you can see here, this visualization is representative of time and length of the works individually. The lighter the color the shorter the work and time runs left to right. As you can see length appears to be lessening as time goes on. We can interpret this as assuming maybe his works were too long for the average consumer. Seeing that, maybe he adjusted the length to maximize the audience. Or maybe he got better at writing and could convey more with less writing. That is what we can take away from this.
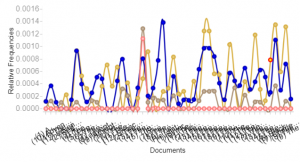
Our second example jumps to voyant. This visualization shows the frequency of dark subject matter showing up within the texts. These terms include murder, death, and killed among other terms. As you can see the frequency of these terms tends to jump around with spikes throughout. One could interpret it to see there is greater grouping in the middle of this writing. The documents are grouped by work and the groups go from left to right in terms of time.
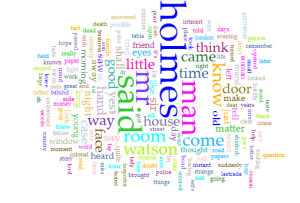
My final visualization is a simple overall word frequency of the Sherlock Holmes short stories. While it doesn’t entirely line up with my original plan, I felt that it was interesting how static and representative of the time that this was written in. Holmes blows all the other terms out of the water, despite the books having a wide cast of recurring characters. The short stories never fail to have Holmes being the center of the show with the side cast of characters merely filling out the world, and Doyle never moves from that philosophy throughout.
These two tools are extremely powerful and can generate amazing visualizations. I feel that voyant can create very good visualizations that can be dynamic and are interesting for the viewer, however its power lies in accessibility. The ease that one can create visualizations with is incredible. Jigsaw on the other hand has an incredible skill ceiling. With enough skill one could make visualizations that blow voyant out of the water. However, it is much more difficult to even get jigsaw off the ground. As such, voyant was a joy to work with, while jigsaw was very difficult.
I feel Clement’s quote is very much reinforced by what I’ve done here. Certain opinions or conclusions that could be drawn from this data could not really be seen from a simple reading. Jigsaw and Voyant allow for a incredibly deep analysis from seemingly infinite angles. That overlap that creates a ‘multidimensional’ lens is why I find these tools so powerful. Different visualizations could show vastly different things, and even within one you could come to a myriad of conclusions.