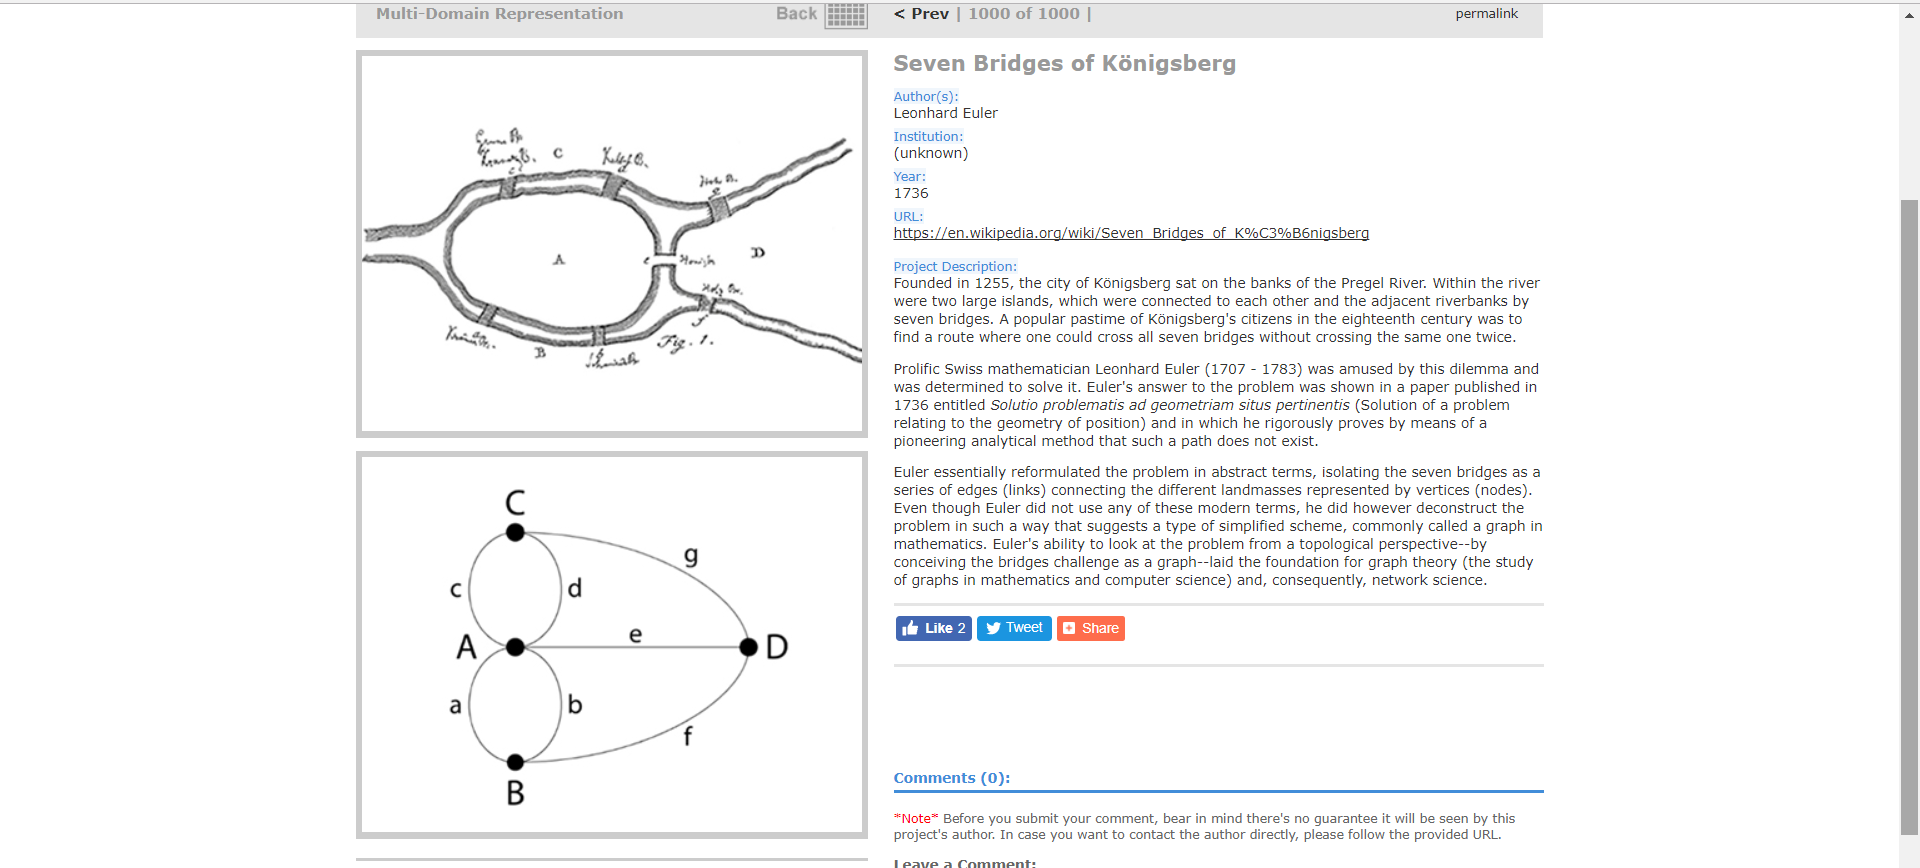
What made me choose these two visualizations from VisualComplexity.com was their difference in color usage, word flow, and way of organizing data. Despite discussing two entirely different topics, one is much more interesting to look at than the other. I believe the second image exemplifies a more dynamic visualization whereas the first displays a more static visualization. The first example is a rather plain way of viewing different bridges in a certain area. The area in discussion was two large islands in the middle of a river. These two islands were connected to each other and the river bank by seven bridges. A game that became popular was for citizens to find a way of crossing all seven bridges without repeating. So using mathematical formula, a mathematician determined that it was not possible. Therefore, the second graph is the next best alternative to an otherwise impossible task.
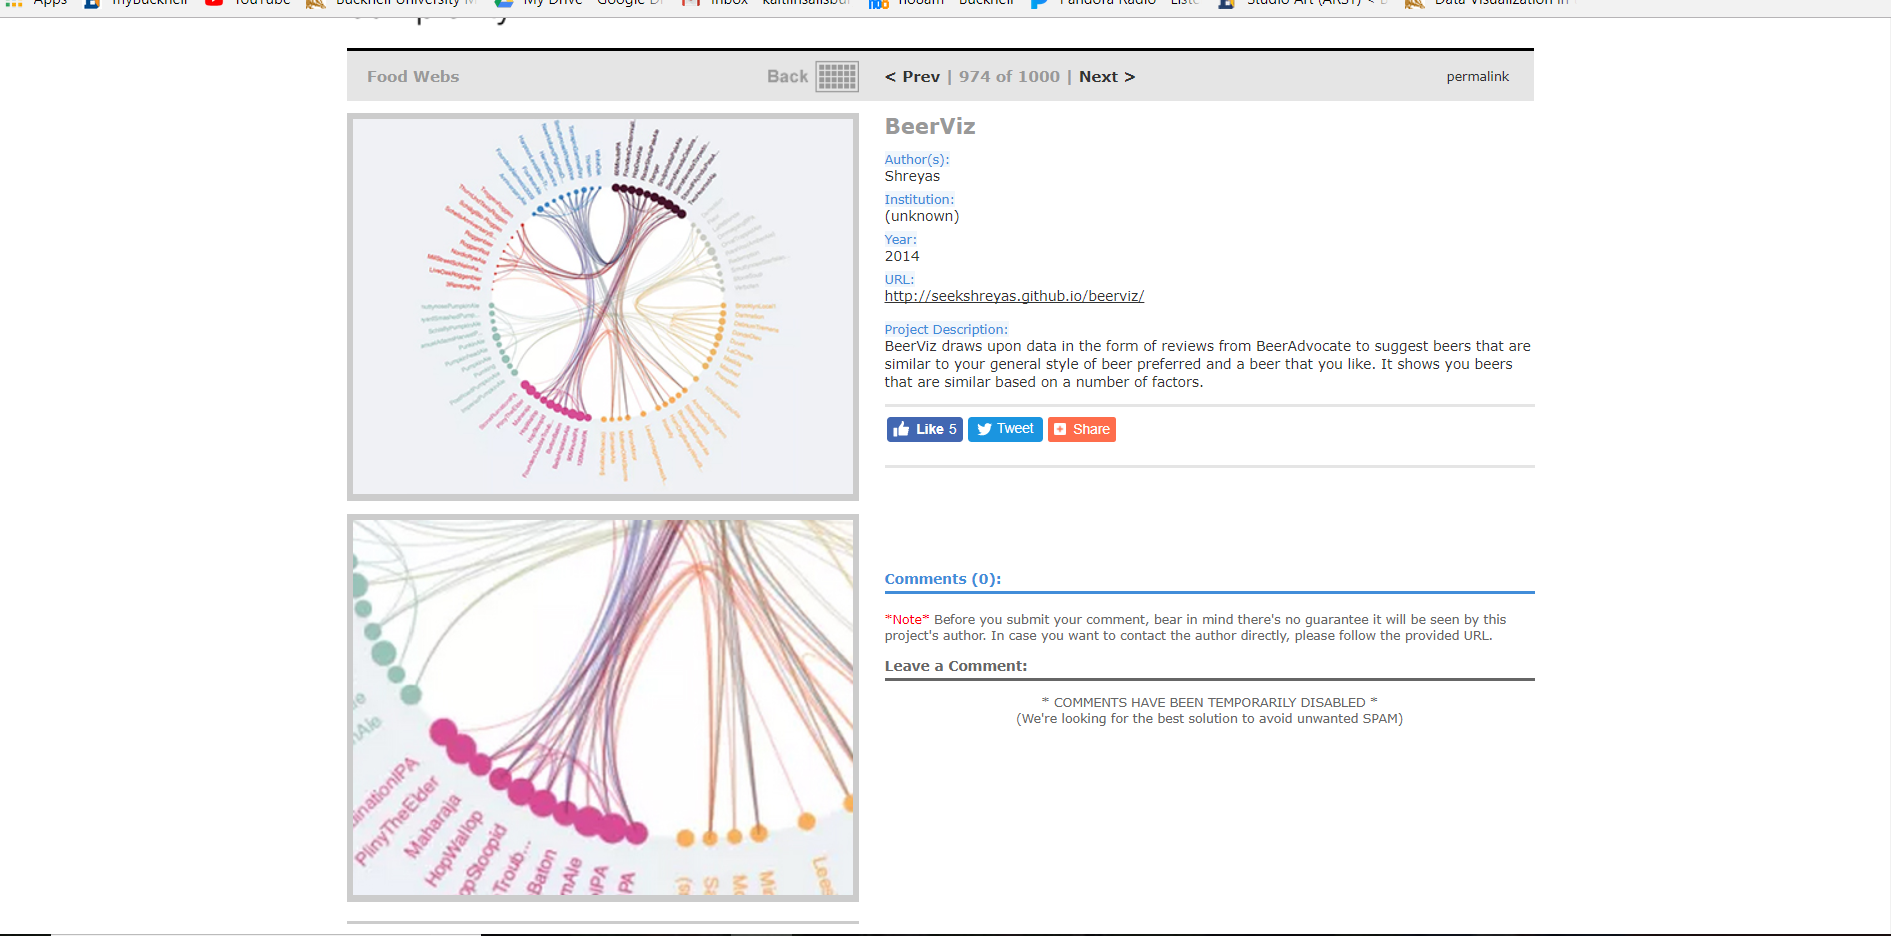
The second graph colorfully explains different beers that are tailored to how someone may like them. Using numbers and factors, each lines connects to another beer that is similar to one that the person may prefer. Running through these numbers and factors, the graph will find the next best beers for the person to try. The only downside to this graph would be the sheer amount of options, making some options hard to read and connections between them difficult to follow. The line thickness also seems to make for some confusing interpretations.
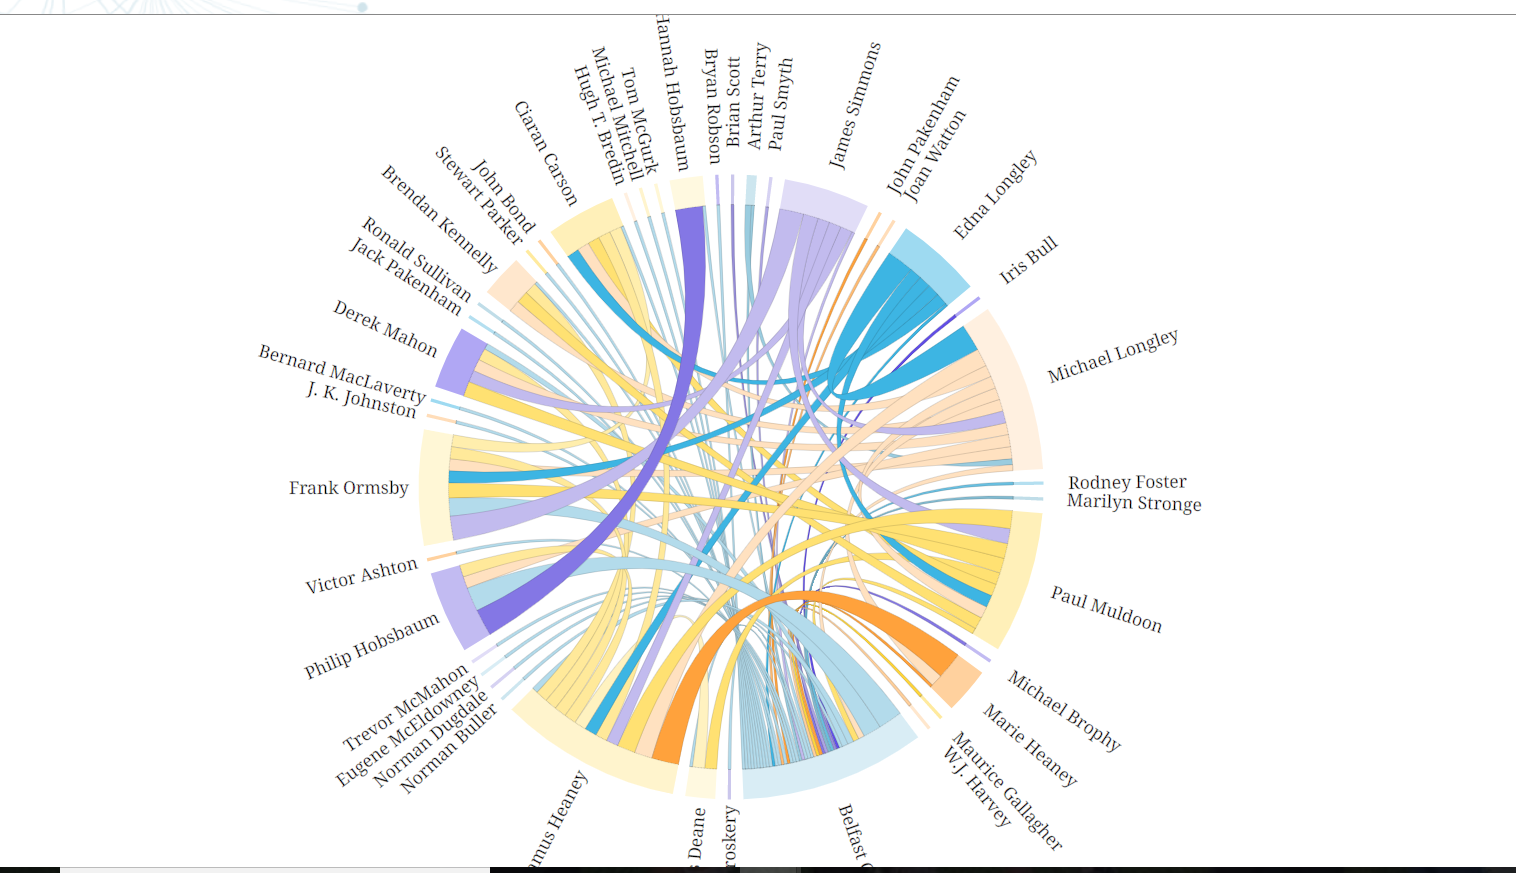
Using the Belfast Group Poetry diagram from the DH Sample Book, I believe it is a better combination of information being presented and the way it is being presented than the previous two samples I chose. Not only is it interactive to see the bond between each person, but it is also clear to understand. Granted, there is still quite a lot of information being represented, it is done so in a way that allows the user to highlight a specific persons name in conjunction to someone else’s name. Looking at information in this way could reveal bonds with people or things that were not previously known based on ideas such as writing style, genre, year published, themes, and many other styles.